
Figures & data
Figure 1. Relative cox-2 mRNA expression in BCC tissues and adjcant normal tissues. The mRNA expression of cox-2 in BCC tissues were significantly higher than that in adjacent normal tissues (p < .001).
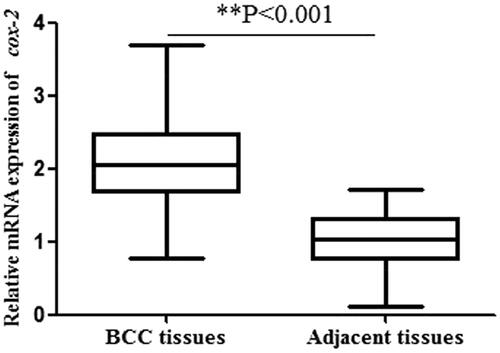
Figure 2. Cox-2 protein expression was detected by western blot analysis. The protein expression of cox-2 in BCC tissues were significantly higher than that in adjacent normal tissues (p < .001).
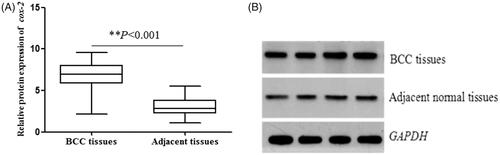
Table 1. The association of cox-2 expression with clinicopathological parameters in patients with BCC.
Figure 3. Kaplan–Meier analysis for estimating the overall survival of patients with BCC. Patients with high expression of cox-2 had shorter overall survival than those with low cox-2 expression (log rank test, p < .001).
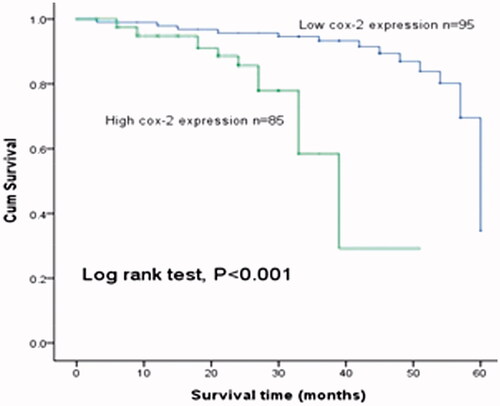
Table 2. Univariate and multivariate analysis of clinical factors and cox-2 in overall survival of BCC.
Table 3. Univariate and multivariate analysis of clinical factors and cox-2 in disease-free survival of BCC.