Figures & data
Figure 1. Baicalein alleviated NIH/3T3 cells cell proliferation. (A, B) Cell viability and (C, D) cell proliferation-related factors were detected by CCK-8 and western blot, respectively. Data is shown as mean ± SD. *p < .05; **p < .01; ***p < .001.
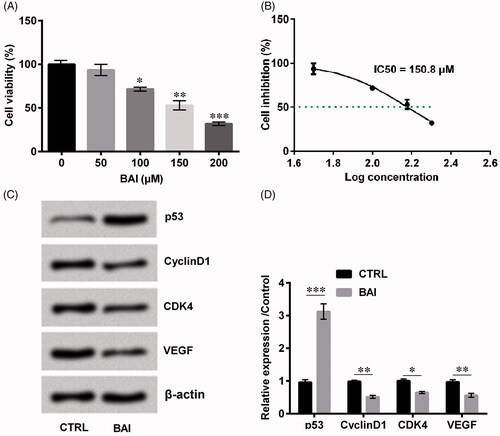
Figure 2. Baicalein alleviated collagen production. The expression of collagen 1, collagen 3 and α-SMA (A) in the mRNA level and (B, C) in protein level were determined by qRT-PCR and western blot, respectively. (D) The total soluble collagen was examined by Sircol Assay. Data is shown as mean ± SD. **p < .01; ***p < .001.
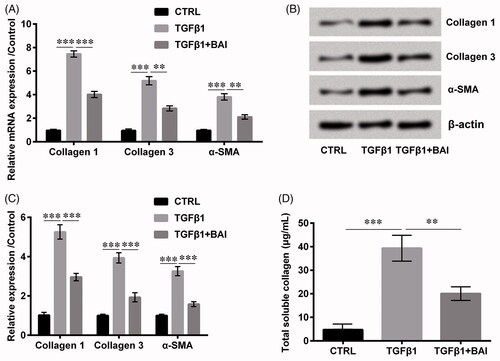
Figure 3. Baicalein positively regulated miR-9 expression by the method of qRT-PCR. Data was shown as mean ± SD. *p < .01.
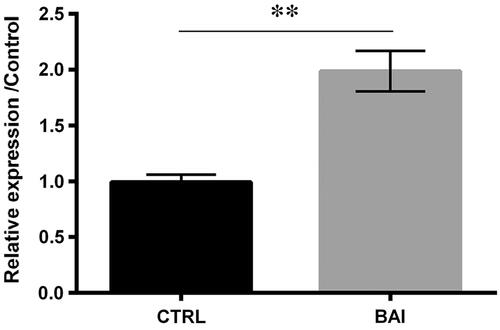
Figure 4. Transfection with miR-9 promoted cell proliferation. (A) miR-9 expression was detected by qRT-PCR. (B) Cell viability was examined by CCK-8. (C, D) Cell proliferation related proteins were detected by western blot. Result was shown as mean ± SD. *p < .05; **p < .01; ***p < .001.
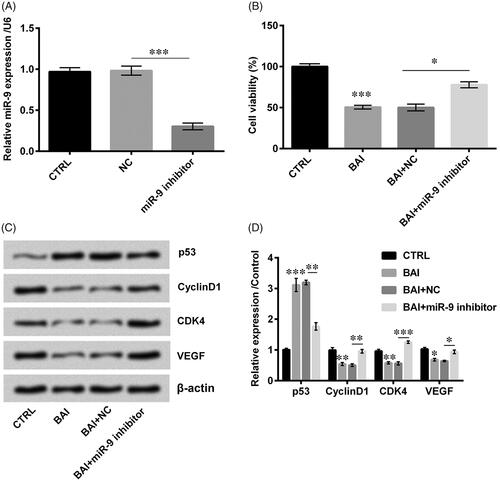
Figure 5. Transfection with miR-9 inhibitor promoted collagen production. The expression of collagen 1, collagen 3 and α-SMA (A) in the mRNA level and (B, C) in protein level were determined by qRT-PCR and western blot, respectively. (D) The total soluble collagen was examined by Sircol Assay. Data was shown as mean ± SD. *p < .05; **p < .01; ***p < .001.
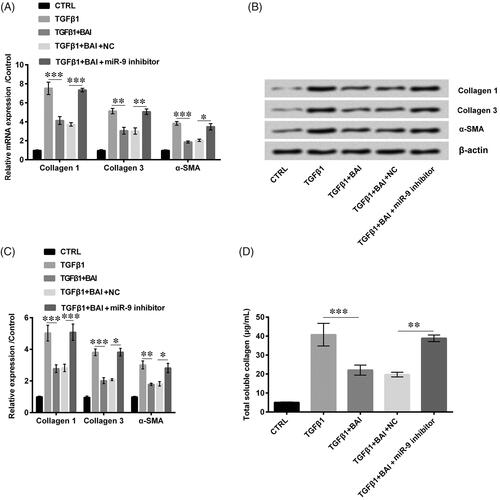
Figure 6. Baicalein inactivated NF-κB and Wnt/β-catenin signal pathways through upregulation of miR-9. (A, B) The expression of NF-κB and Wnt/β-catenin signalling related factors were determined by western blot. Data was shown as mean ± SD. *p < .05; **p < .01; ***p < .001.
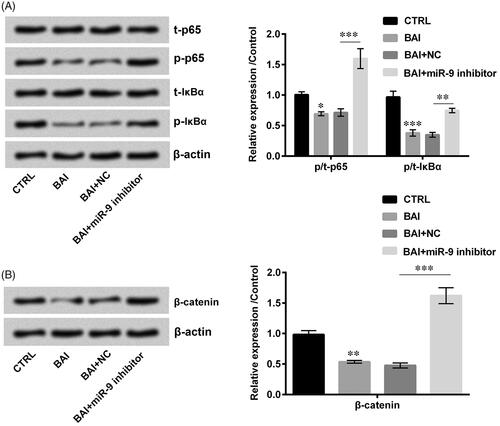
Figure 7. Insulin-like growth factor (IGF)-1 was authenticated as a target of miR-9. (A) miR-9 expression was detected by qRT-PCR. (B) The fluorescence activity of IGF-1 was examined by luciferase reporter assay. (C, D) The levels of IGF-1 were detected by qRT-PCR and western blot. (E) miR-9 and IGF-1 binding sites were predicted by TargetScanHuman 7.1. Result was shown as mean ± SD. **p < .01; ***p < .001.
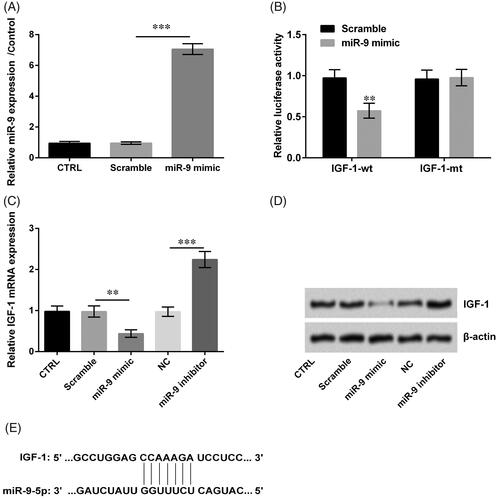
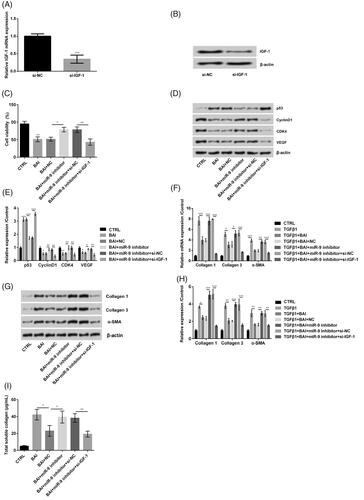
Figure 8. Baicalein inhibited cell proliferation and cell collagen synthesis by inducing miR-9/insulin-like growth factor (IGF)-1 axis. (A, B) IGF-1 expression was detected by qRT-PCR. (C) Cell viability was examined by CCK-8. (D, E) Cell proliferation related proteins were detected by western blot. (F–H) The expression of collagen 1, collagen 3 and α-SMA in the mRNA level and in protein level were determined by qRT-PCR and western blot, respectively. (I) The total soluble collagen was examined by Sircol Assay. Data was shown as mean ± SD. *p < .05; **p < .01; ***p < .001.