Figures & data
Figure 1. (A) UV-visible absorption spectrum of synthesized AuNPs. (B) Dynamic light scattering (DLS) images of AuNPs synthesized from Magnolia officinalis and the size of the nanoparticles is 128 nm.
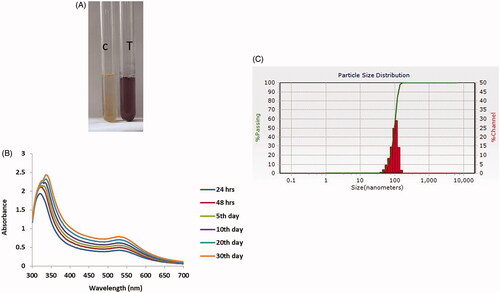
Figure 2. Atomic force microscopyanalysis of gold nanoparticles synthesized from Magnolia officinalis.
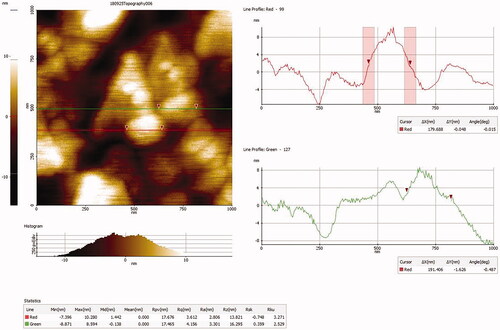
Figure 3. (A) High resolution transmission electron microscopy (HR-TEM) and (B) Energy dispersive X-ray (EDX) and analysis of AuNPs synthesized from Magnolia officinalis.
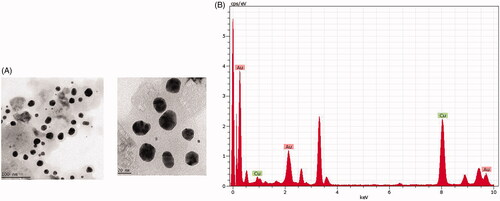
Figure 4. Fourier transforms infrared (FTIR) spectroscopy analysis of AuNPs synthesized from Magnolia officinalis.
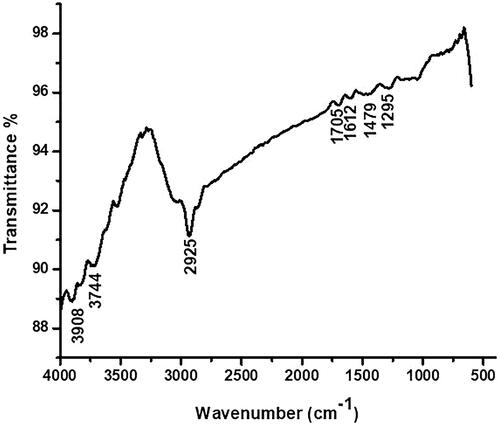
Figure 5. Cytotoxic potential of AuNPs from Magnolia officinalis in A549 cells. This experiment was repeated thrice and the bars in the graph represent S.E. (*p < .05)
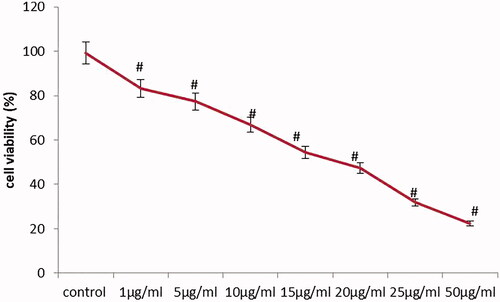
Figure 6. Effect of AuNPs from Magnolia officinalis arbitrated ROS measurements in A549 cells. This experiment was repeated thrice and the bars in the graph represent S.E. (*p < .05, #p < .01).
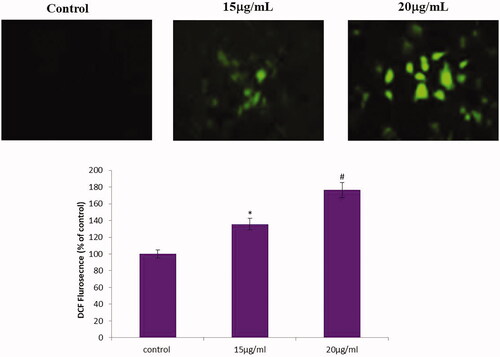
Figure 7. AuNPs mediated apoptotic morphological studied by TUNEL assay and DAPI/PI staining.
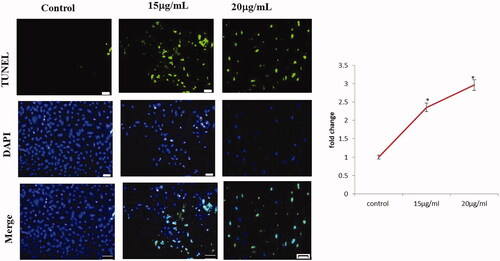
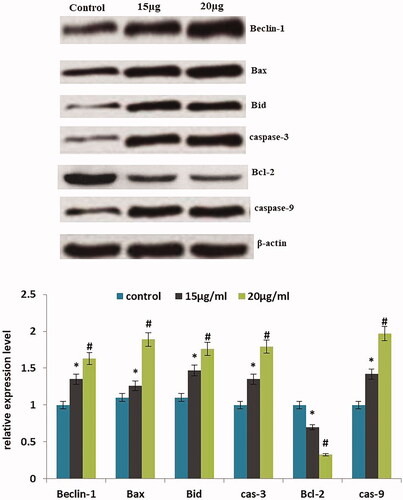
Figure 8. Western blotting images for Bax, Bcl-2, Bid, β-actin, Beclin-1, caspase-3 protein expression in AuNPs treated A549 cells.