Figures & data
Table 1. Sequence of the primers used in the real-time RT-PCR analysis at the present study.
Figure 1. SEM was applied to morphological study of the fabricated PVDF (A) and PVDF-PANI (B) nanofibrous scaffold.
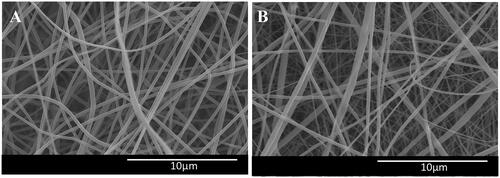
TABLE 2. Tensile results: mechanical properties of the PVDF nanofibrous scaffolds before and after composite with PANI.
Figure 2. Optical micrographs of the dental pulp stem cells (DPSCs) (A), SEM images of the DPSCs-seeded electrospun PVDF scaffold in the absence (B) and presence of the PEMF exposure (ELF + PVDF) (C), DPSCs-seeded electrospun PVDF-PANI scaffold in the absence (D) and presence of the PEMF exposure (ELF + PVDF) (E) at day 14 while cultured under osteogenic medium.
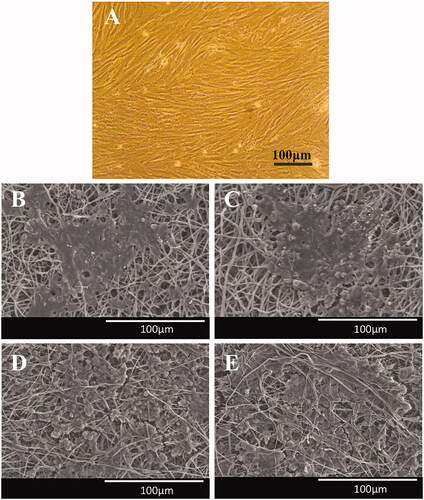
Figure 3. Cell attachment (A) and protein adsorption (B) assays of the fabricated PVDF and PVDF-PANI nanofibrous scaffold at the presence and absence of the PEMF exposure. The viability and proliferation rate of the DPSCs during 10 days to display non-toxicity and biocompatibility of the PVDF and PVDF-PANI scaffolds and PEMF exposure under basal medium. The significant differences (p<.05) between groups are indicated with star sign.
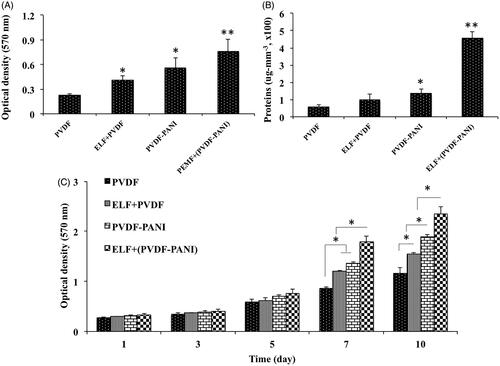
Figure 4. The ALP activity (A) and calcium content (B) assays of the differentiated DPSCs while cultured on the PVDF and PVDF-PANI under osteogenic medium at the absence and presence of the PEMF at days 7 and 14 after cell seeding. The significant differences (p<.05) between groups are indicated with star sign.
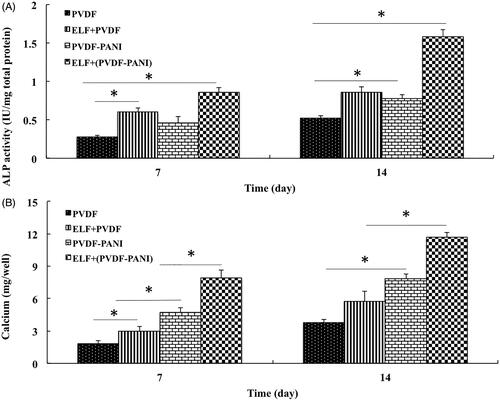
Figure 5. Relative expression of Runt-related transcription factor 2 (Runx2), Collagen type-1 (Col-I), Osteonectin (OSN), Osteocalcin (OSC) and Osteopontin (SPP1) at days 7 and 14 for DPSCs cultured on the PVDF and PVDF-PANI under osteogenic medium at the absence and presence of the PEMF. The significant differences (p<.05) between groups are indicated with star sign.
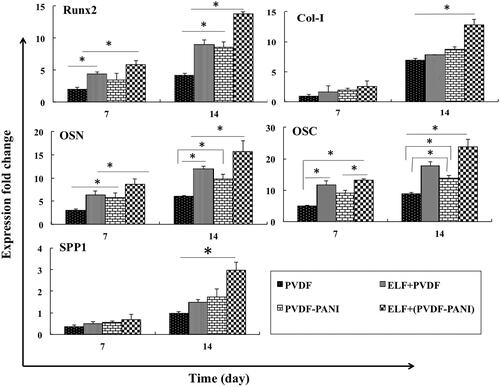
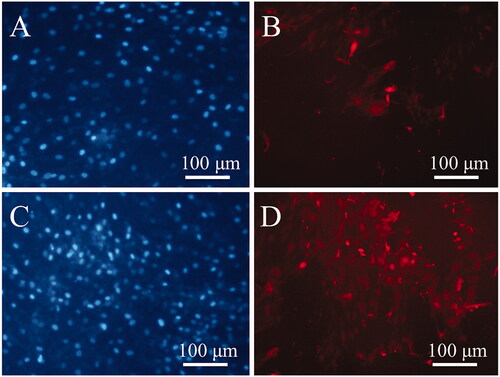
Figure 6. Immunocytochemistry (ICC) staining for osteocalcin protein in the differentiated DPSCs cultured on the PVDF (B) and PVDF-PANI under osteogenic medium and PEMF (D). DAPI stained of the DPSCs cultured on the PVDF (A) and PVDF-PANI (C).