Figures & data
Figure 1. NEAT1 expression was increased in AS mouse serum, and t-BHP-treated HUVECs were analyzed by qRT-PCR. Determination of NEAT1 expression in serum samples obtained from AS mice (A) and t-BHP-treated HUVECs (B). **p < .01.
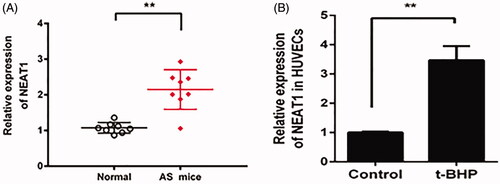
Figure 2. NEAT1 promoted proangiogenic capacity while inhibiting apoptosis in t-BHP-treated HUVECs. (A) t-BHP-treated HUVECs were transfected with pcDNA3.1-NEAT1 for 48 h, and NEAT1 expression was detected by qRT-PCR. (B) HUVEC viability was evaluated by CCK-8 assay. (C) HUVEC migration was evaluated by Transwell assay. (D) HUVEC migration was evaluated by wound healing assay. (E) The apoptotic rate of HUVECs was evaluated by flow cytometry analysis. (F) Caspase-3 activity was determined in t-BHP-treated HUVECs. **p<.01.
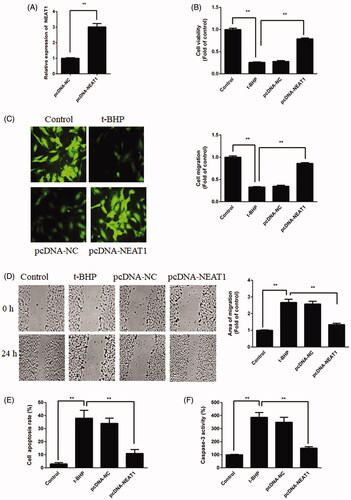
Figure 3. NEAT1 negatively regulated miR-181d-5p expression. (A) Putative binding sites between miR-181d-5p and NEAT1. (B) Relative luciferase activity in HUVECs transfected with miR-181d-5p mimic and NEAT1 wild-type (NEAT1-Wt) and mutant (NEAT1-Mut) sequences. (C) HUVECs were transfected with pcDNA3.1-NEAT1, and miR-181d-5p expression was measured by qRT-PCR. Determination of miR-181d-5p expression in samples obtained from AS mice (D) and t-BHP-treated HUVECs (E). (F) HUVECs were transfected with miR-181d-5p mimic, miR-181d-5p inhibitor and controls, and miR-181d-5p expression was measured by qRT-PCR. (G) HUVECs were transfected with pcDNA3.1-NEAT1 and control, and miR-181d-5p expression was measured by qRT-PCR. *p<.05, **p<.01, ##p<.01.
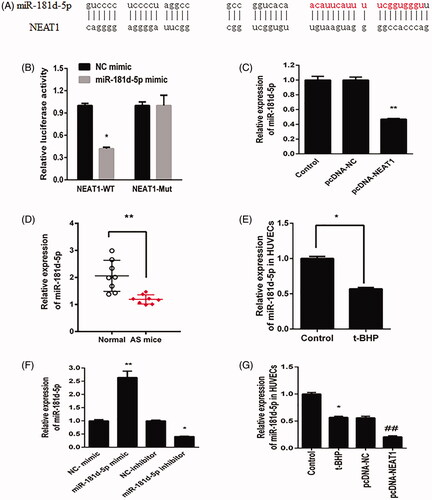
Figure 4. miR-181d-5p inhibition of NEAT1 promotes proangiogenic capacity in t-BHP-treated HUVECs. HUVECs were transfected with pcDNA3.1-NEAT1 and miR-181d-5p mimic or anti-miR-181d-5p. (A) Cell viability was analyzed by CCK-8 assay. (B, C) HUVEC migration was evaluated by Transwell and wound healing assays. (D) The apoptotic rate of HUVECs was evaluated by flow cytometry analysis. **p < .01, ##p < .01, $$p < .01.
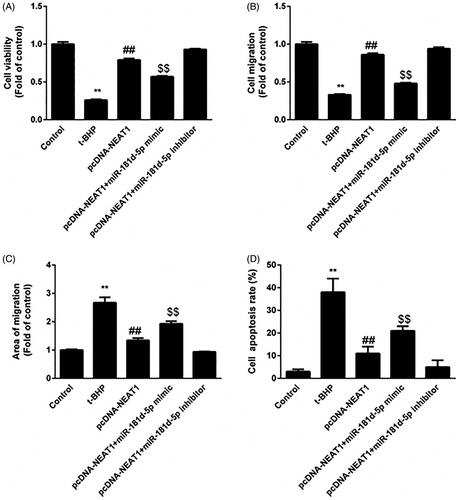
Figure 5. NEAT1 regulated the miR-181d-5p/CDKN3A axis in t-BHP-treated HUVECs. (A) HUVECs were treated with miR-181d-5p mimic and anti-miR-181d-5p, and CDKN3 expression was determined by Western blot analysis. (B) RIP analysis for the Ago2 enrichment of NEAT1 and CDKN3 in HUVECs treated with sh-NEAT1. (C) NEAT1 and CDKN3 expression according to pull-down assay with biotin-miR-181d-5p. (D) t-BHP-treated HUVECs were transfected with pcDNA3.1-NEAT1 and miR-181d-5p mimic or anti-miR-181d-5p, and CDKN3 expression was measured by Western blot analysis. (E) HUVEC viability was examined by CCK-8 assay. (F) The migration of HUVECs was detected. (G) The apoptotic rate was determined in t-BHP-treated HUVECs. **p < .01, ##p < .01, $p < .05.
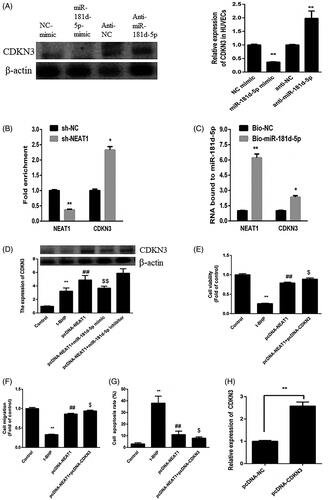
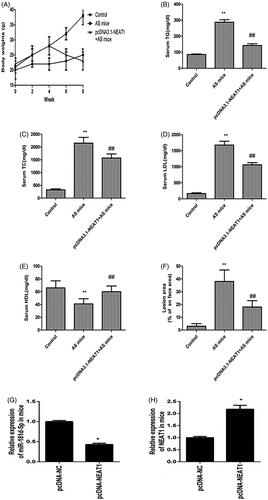
Figure 6. NEAT1 suppressed atherosclerotic plaque formation in AS mice. (A) ApoE−/− mice were treated with HFD for 8 weeks and body weight was evaluated. The serum levels of TC (B), TG (C), LDL (D), and HDL (E) were detected in AS mice with NEAT1 overexpression. (F) Measurement of the atherosclerotic lesion area by Oil Red O staining. (G) miR-181d-5p expression was detected in the thoracic aortic plaques of AS mouse. (H) NEAT1 level was detected in the thoracic aortic plaques of AS mouse. *p < .05, **p < .01, ##p < .01.