Figures & data
Figure 1. The stemness of KRAS-mut NSCLC cells not KRAS-wild type NSCLC cells was promoted by Eriotinib treatment. (A) The mRNA levels of ALDH1 and Nanog were detected in KRAS-mut and -wt NSCLC cells with or without Eriotinib treatment. (B) The protein levels of ALDH1 and Nanog were examined in the cells described in (A). (C and D) The spheroid formation capacity was evaluated in the cells depicted in (A) by measuring spheroid size (C) and number (D). (E) The ALDH activity was determined in the cells described in (A). Data were presented as mean ± SD; n ≥ 3 **p < .01 versus control.
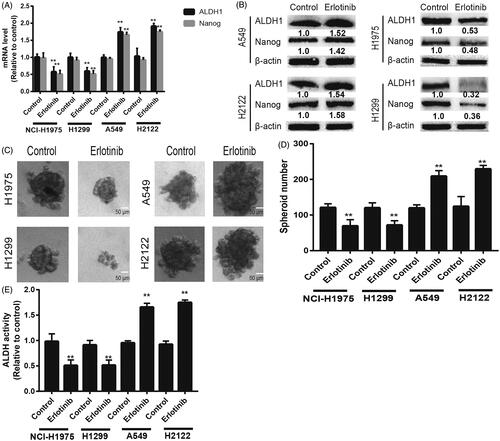
Figure 2. The stemness of KRAS-mut NSCLC cells not KRAS-wild type NSCLC cells was promoted by Gefitinib treatment. (A) The mRNA levels of ALDH1 and Nanog were detected in KRAS-mut and -wt NSCLC cells with or without Gefitinib treatment. (B) The protein levels of ALDH1 and Nanog were examined in the cells described in (A). (C and D) The spheroid formation capacity was evaluated in the cells depicted in (A) by measuring spheroid size (C) and number (D). (E) The ALDH activity was determined in the cells described in (A). Data were presented as mean ± SD; n ≥ 3 **p < .01 versus control.
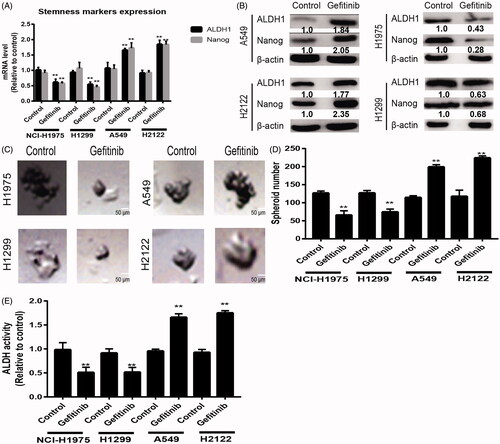
Figure 3. SHP2 is activated in KRAS-mut NSCLC cells with TKIs treatment followed by MEK activation. (A) The expression levels of pSHP2 and pERK were detected in KRAS-mut and -wt NSCLC cells with or without Eriotinib treatment plus SHP2 knockdown and E76K SHP2 overexpression or not. (B) The expression levels of pSHP2 and pERK were detected in KRAS-mut cells with MEK inhibitor treatment at different times as indicated – (48 h), cells collected after overnight serum starvation.
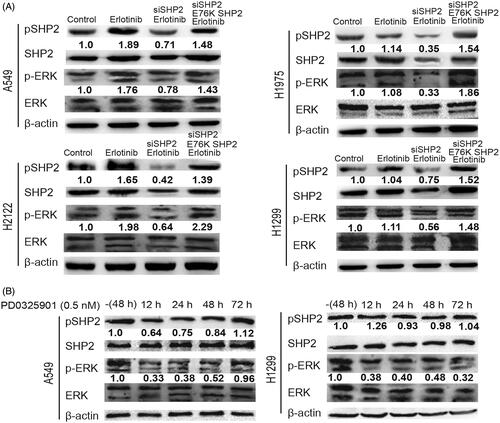
Figure 4. Inhibition of SHP2 suppressed the stemness of KRAS-mut NSCLC cells via inactivating MEK signaling. (A and B) The mRNA levels of ALDH1 and Nanog were examined in A549 and H2122 cells with treatment as indicated. (C) The protein levels of ALDH1 and Nanog were detected in A549 and H2122 cells with treatment as indicated. (C and D) The spheroid formation ability was evaluated in A549 and H2122 cells with treatment as indicated. (E) ALDH1 activity was determined in A549 and H2122 cells with treatment as indicated. Data were presented as mean ± SD; n ≥ 3, *p < .05, **p < .01 versus control.
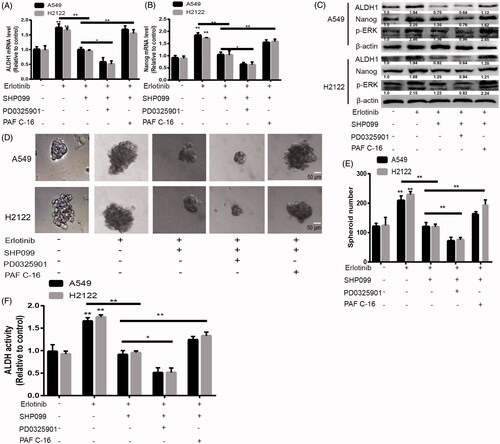
Figure 5. Inhibition of SHP2 had little effects on the stemness of KRAS-mut NSCLC cells without Erlotinib treatment. (A and B) The mRNA levels of ALDH1 and Nanog were detected in A549 and H2122 cells with or without SHP099 treatment. (C) The protein levels of ALDH1 and Nanog were examined in A549 and H2122 cells with or without SHP099 treatment. (D and E) The spheroid formation capacity was determined in A549 and H2122 cells with or without SHP099 treatment. (F) ALDH1 activity was measured in A549 and H2122 cells with or without SHP099 treatment. Data were presented as mean ± SD; n ≥ 3, ns, no significance.
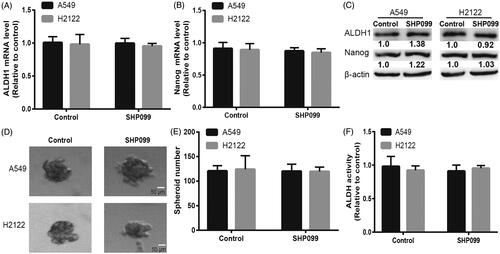
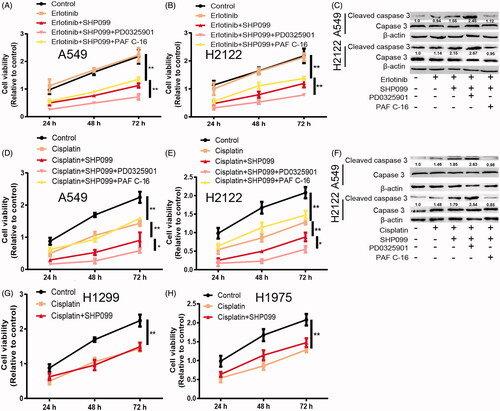
Figure 6. SHP2 inhibition enhances TKI and chemotherapeutic sensitivity in KRAS-mut NSCLC cells, which is potentiated by MEK inhibition. (A and B) Cell viability was detected in A549 and H2122 cells with the treatment as indicated. (C) The expression of Cleaved caspase 3 was examined in A549 and H2122 cells with the treatment as indicated. (D and E) Cell viability was detected in A549 and H2122 cells with the treatment as indicated. (F) The expression of Cleaved caspase 3 was examined in A549 and H2122 cells with the treatment as indicated. (G and H) Cell viability was examined in H1299 and H1975 cells with cisplatin treatment as well as SHP2 inhibition. Data were presented as mean ± SD; n ≥ 3, *p < .05, **p < .01 versus control.