Figures & data
Figure 1. Flowchart of the enrolled studies selection procedure.
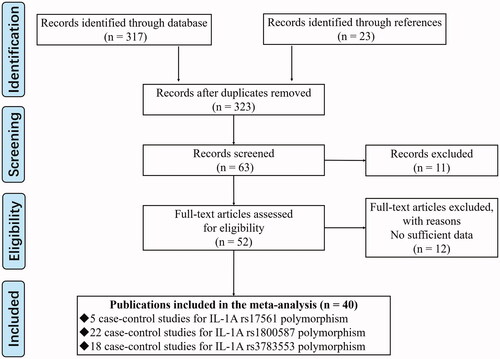
Table 1. Characteristics of the enrolled studies on IL-1A polymorphism and cancer.
Table 2. Results of pooled analysis for IL-1A polymorphism and cancer susceptibility.
Figure 2. Meta-analysis of the association between IL1A rs1800587 polymorphism and cancer risk.
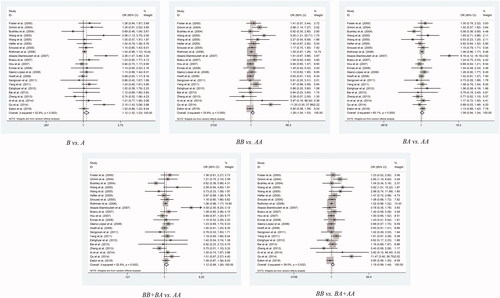
Figure 3. Meta-analysis of the association between IL1A rs3783553 polymorphism and cancer risk.
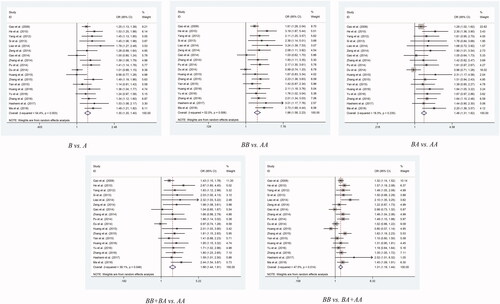
Figure 4. Sensitivity analysis for IL1A rs1800587 polymorphism and cancer risk.
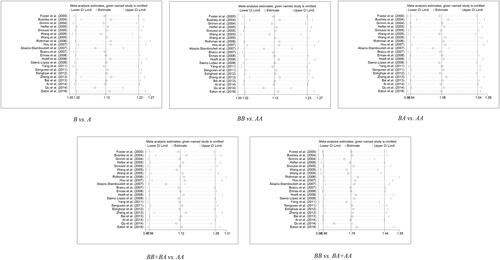
Figure 5. Sensitivity analysis for IL1A rs3783553 polymorphism and cancer risk.
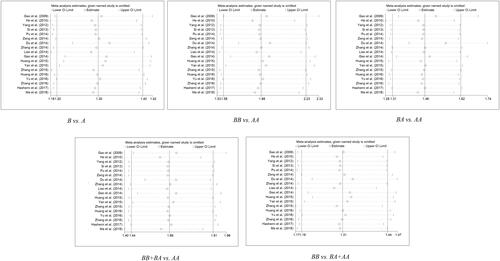
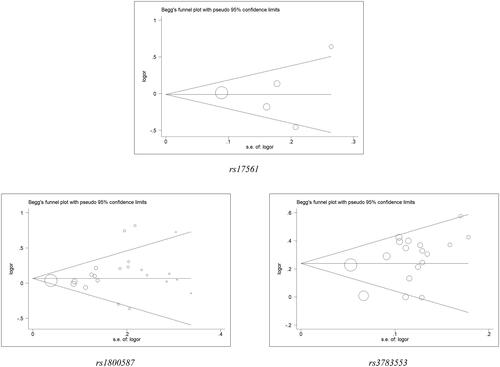
Figure 6. Begg’s funnel plot for IL1A polymorphisms and cancer risk. The x-axis is log (OR), and the y-axis is natural logarithm of OR. The horizontal line in the figure represents the overall estimated log (OR). The two diagonal lines indicate the pseudo 95% confidence limits of the effect estimate.