Figures & data
Table 1. Baseline characteristics of patients.
Figure 1. The comparison of pleural ADA levels between TB group and non-TB group. ***: p < .001.
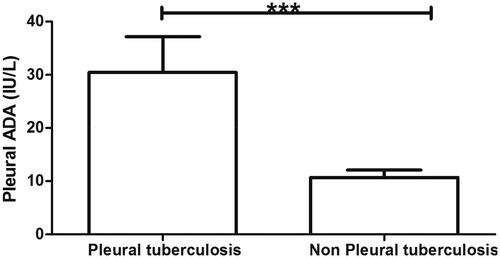
Figure 2. The positive rate of T-SPOT. A and B in TB and non-TB groups. ***: p < .001.
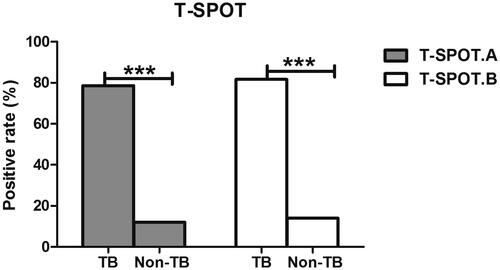
Table 2. The positive rate of T-SPOT.
Table 3. Logistic regression analysis.
Figure 3. ROC analysis based on the number of T-SPOT A blots in patients with pleurisy ADA levels below 40 IU/L. The area under the curve (AUC) was 0.822, with the sensitivity of 91.0% and specificity of 72.7%.
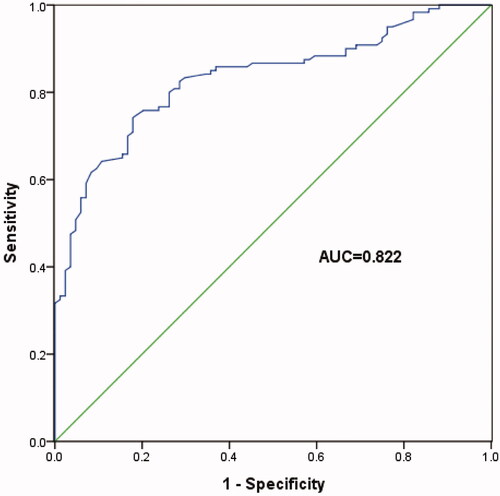
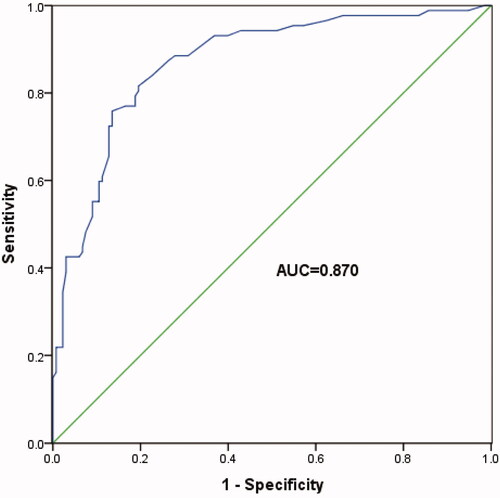
Figure 4. ROC analysis based on the number of T-SPOT B blots in patients with pleurisy ADA levels below 40 IU/L. The area under the curve (AUC) was 0.870, with the sensitivity of 95.5% and specificity of 77.3%.