
Figures & data
Figure 1. Sirt1 positively regulates H3T3ph in osteosarcoma cells. (A) Western blotting was utilized for testing the protein levels of H3T3ph and Sirt1 in Saos-2, MG-63 and HOS cells. (B) Hexa-histidine (His6)-tagged Sirt1 (Sirt1+) plasmid was transfected into MG-63 and HOS cells. Western blotting was utilized for testing the protein levels of H3T3ph, H3 and Sirt1. (C) Two siRNAs targeting Sirt1 (si-Sirt1-1 and si-Sirt1-2) were transfected into MG-63 and HOS cells, respectively. Western blotting was utilized for testing the protein levels of H3T3ph, H3 and Sirt1. N = 3. ***p˂.001.
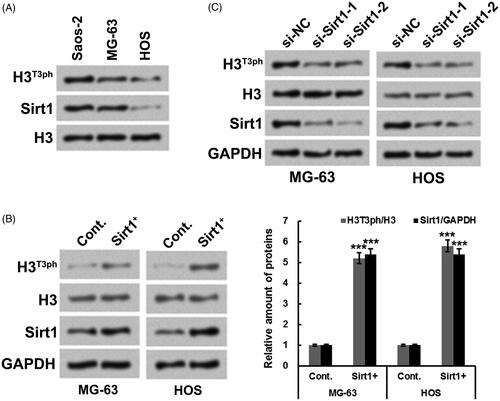
Figure 2. Sirt1 directly interacts with H3 and phosphorylates H3T3 in osteosarcoma cells. (A) The association between Sirt1 and H3 in MG-63 cells was tested by co-immunoprecipitation assay. (B) HA-tagged H3WT or H3T3A plasmid was transfected into H3−/− HOS cells. Co-immunoprecipitation assay was utilized to test Sirt1 binding. (C) GST pull-down assay was carried out to further test the relationship between Sirt1 and H3 using GST-tagged Sirt1. (D) Whether Sirt1 could phosphorylate H2B was detected using an in vitro kinase activity assay. (E) The samples from in vitro kinase activity assay were evaluated by Western blotting to measure the H3T3ph, H3 and Sirt1 levels. N = 3.
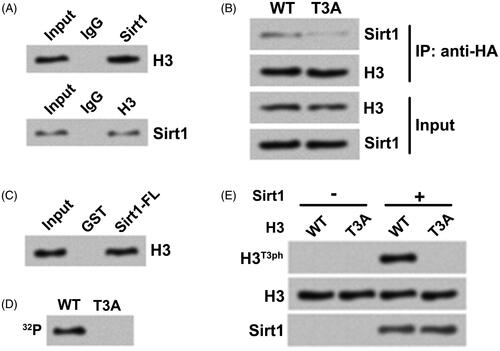
Figure 3. Sirt1 facilitates osteosarcoma cell autophagy under starvation condition. Followed by maintained at complete medium or starved (EBSS) medium, (A) the numbers of autophagosomes in WT or Sirt1−/− MG-63 and HOS cells were counted, respectively, (B) the LC3-I and LC3-II levels in WT or Sirt1−/− MG-63 cells were measured. (C) Plasmid expressing EGFP-tagged LC3 was transfected into WT or Sirt1−/− HOS cells. Followed by maintainance at different conditions, the EGFP-LC3 puncta number was measured. (D) The degradation of long-lived protein in WT or Sirt1−/− HOS cells under complete or starvation condition were tested by long-lived protein degradation assay. (E) An MG-63 cell line stably expressing Dox-inducible siRNA targeting ATG5, ATG7 and ATG14 was constructed and transfected with Sirt1-expressing plasmid. Followed by maintained at different condition, Western blotting was carried out to test the protein levels of ATG5, ATG13, ATG14, LC3-I and LC3-II. N = 3. **p˂.01.
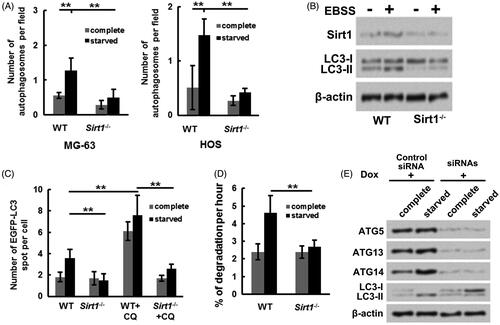
Figure 4. H3T3ph takes part in the Sirt1-caused osteosarcoma cell autophagy. H3−/− Sirt1+/+ MG-63 cells were co-transfected with either H3WT or H3T3A and EGFP-LC3-expressing plasmids. Followed by growth at complete medium or starved medium, (A) the EGFP-LC3 puncta number, along with H3 and Sirt1 levels were detected, (B) the H3T3ph, LC3-I and LC3-II levels were measured. (C) Sirt1 was overexpressed in WT MG-63 cells. Followed by either H3WT or H3T3A and EGFP-LC3-expressing plasmids transfection and grown at different conditions, the EGFP-LC3 puncta number, along with H3T3ph, H3 and Sirt1 levels were measured. N = 3. **p˂.01.
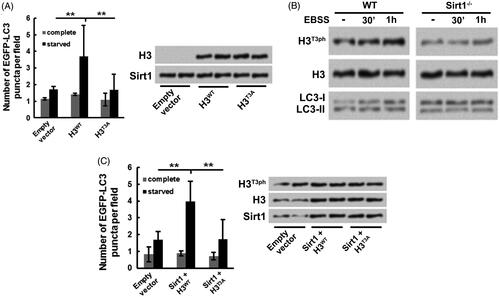
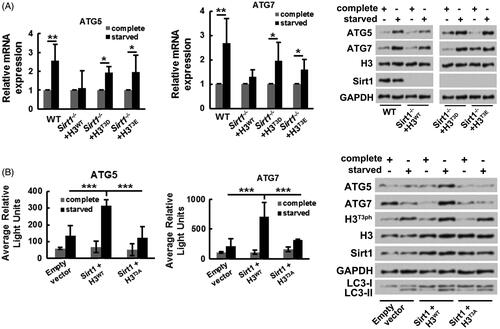
Figure 5. Sirt1-H3T3ph axis facilitates osteosarcoma cell autophagy through activating ATG genes transcription. (A) WT or Sirt1−/− MG-63 cells were co-transfected with H3WT, H3T3D, or H3T3E. Followed by growth at different medium, the mRNA and protein expressions of ATG5 and ATG7 were tested by qRT-PCR and Western blotting, respectively. (B) MG-63 cells were co-transfected with Sirt1, H3WT or H3T3A-expressing plasmids and luciferase reporter plasmids that contain the promoter region of ATG5 and ATG7. Followed by growth at different medium, the transcriptional activities of ATG5 and ATG7 genes were recorded by average relative light unit using the Turner Designs Luminometer. The ATG5, ATG7, H3T3ph, H3, Sirt1, LC3-I and LC3-II levels were tested by Western blotting. N = 3. *p˂.05, **p˂.01 or ***p˂.001.
Data availability
The datasets used and/or analyzed during the current study are available from the corresponding author on reasonable request.