Figures & data
Figure 1. The expression of SFTPC in human cancers. (A) Expression profile for surfactant protein C (SFTPC) in human cancer using the SAGE digital gene expression displayer (https://cgap.nci.nih.gov/SAGE/Viewer). (B) Expression of SFTPC in different types of cancers (Oncomine: https://www.oncomine.org). (C) Expression of SFTPC across all TCGA tumours (TIMER: https://cistrome.shinyapps.io/timer/).
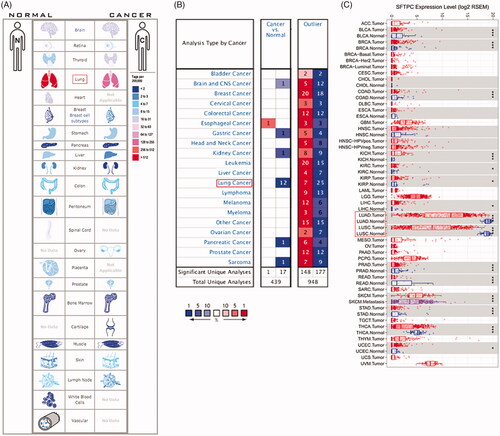
Figure 2. SFTPC expression is significantly downregulated in lung cancer. (A) A meta-analysis of SFTPC expression in lung cancers using Lung Cancer Explore (http://lce.biohpc.swmed.edu/lungcancer/index.php#about); (B) Expression of SFTPC in five pairs of LUSC tissues and the adjacent tissues. (C) Expression of SFTPC in five pairs of LUAD tissues and the adjacent tissues. **p < .01.
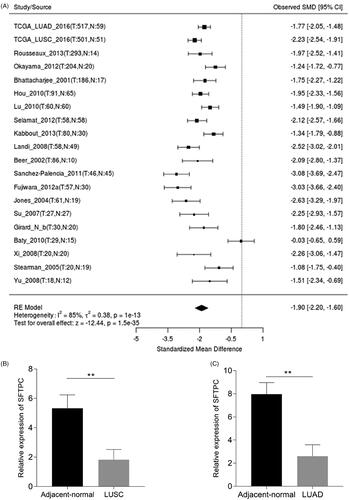
Figure 3. SFTPC protein expression was significantly lower in both LUAD and lung squamous carcinoma (LUSC) tissues in comparison with normal lung tissues. SFTPC immunohistochemistry (IHC) staining images: in normal lung tissues (left), in LUSC tissues (middle), and in LUAD tissues (right). Images were downloaded from the Human Protein Atlas (HPA) (http://www.proteinatlas.org/).
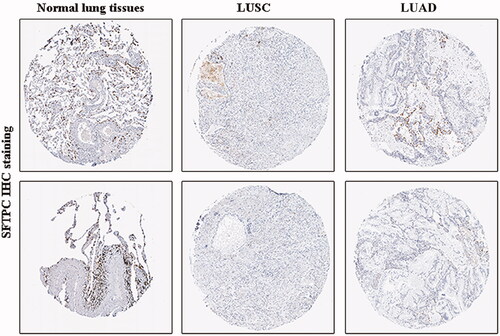
Figure 4. Survival analysis of SFTPC expression in lung cancer using Lung cancer explorer. Meta-analyses indicated that low expression of SFTPC was associated with lower survival in LUAD (A), but not in LUSC (B).
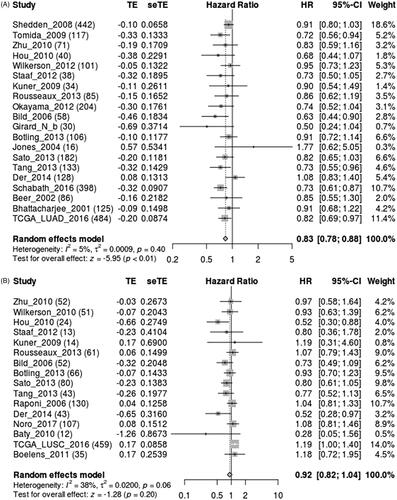
Figure 5. SFTPC inhibits cell proliferation in LUAD cell lines. (A) Quantitative reverse-transcription polymerase chain reaction (qRT-PCR) analyzed SFTPC mRNA expression in LUAD cell lines. (B) Western blot analysis of SFTPC protein expression in LUAD cell lines. (C) Western blot analysis was used to detect the expression of SFTPC protein in A549 after lenti-APAF1 infection and in H1650 after si-SFTPC transfection. (D) Overexpression of SFTPC inhibited cell proliferation in A549 cell lines. (E) Inhibition of SFTPC promoted cell proliferation in H1650 cell lines. (F) SFTPC inhibited tumour growth in mice xenograft tumour model by subcutaneous inoculation with lenti-SFTPC or control vector A549 cells (five mice per group); (G) The weights of xenograft tumours are detected at the day 45. *p < .05; **p < .01; ***p < .001; ****p < .0001.
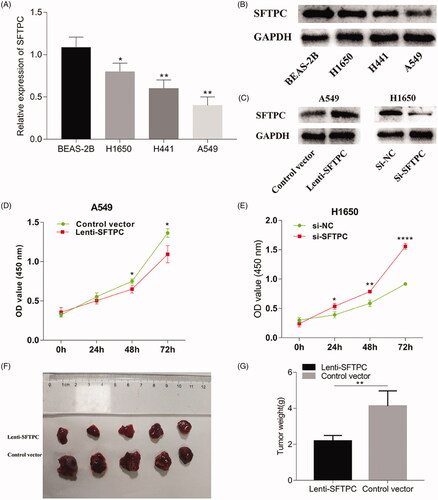
Figure 6. miR-629-3p was upregulated in LUAD and a potential negative regulator to SFTPC. (A) miR-629-3p and miR-409-3p were potential regulatory factors to SFTPC mRNA. (B) RT-qPCR analyzed miR-409-3p expression in five pairs of LUAD tissues and the adjacent tissues. (C) qRT-PCR analyzed miR-629-3p expression in five pairs of LUAD tissues and the adjacent tissues. (D) qRT-PCR analyzed miR-629-3p expression in LUAD cell lines. (E) The level of miR-629-3p was negatively correlated with SFTPC in LUAD (Starbase 3.0). *p < .05; **p < .01; ***p < .001.
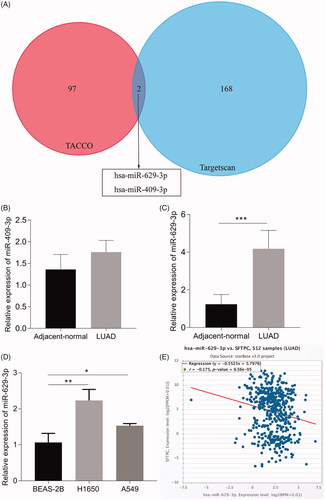
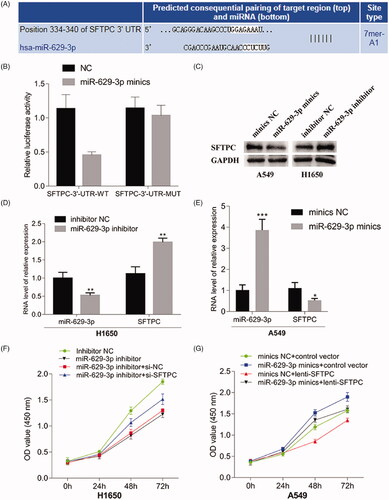
Figure 7. MiR-629-3p inhibited SFTPC expression by directly binding to the SFTPC 3'-UTR. (A) There existed a putative miR-629-3p binding site in the 3'-UTR of SFTPC mRNA(Tagetscan). (B) Wild-type (WT) and mutant (MUT) sequences of SFTPC 3'-UTR, miR-629-3p mimics, and mimics’ negative control (NC) were cotransfected into 293T cells. (C) A549 or H1650 cells were transfected with miR-629-3p mimics or inhibitor and its corresponding control and then the expression of SFTPC was detected by Western blot assays (C) and qRT-PCR (D, E). Cell proliferation of lung cancer cell lines was detected after transfected with miR-629-3p inhibitor and SFTPC siRNA (H1650) or transfected with miR-629-3p mimics and infected lenti-SFTPC (A549) (F, G).