Figures & data
Figure 1. Flow chart of the study selection procedure in this meta-analysis.
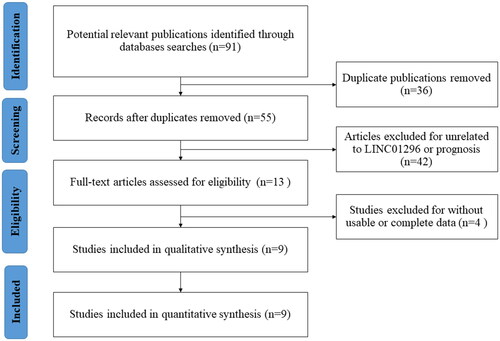
Table 1. Characteristics of the eligible studies included in the meta-analysis (n = 9).
Figure 2. Forest plots of studies evaluating (a) the association between LINC01296 expression with overall survival (OS), (b) independent prognostic value, (c) sensitivity analysis for OS, and (d) publication bias plots of OS. HR: hazard ratio; CI: confidence interval.
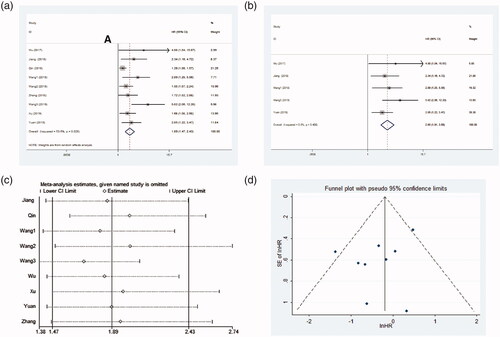
Figure 3. Forest plots of the subgroup analysis evaluating HRs of LINC01296 for overall survival by the factors of (a) cancer type, (b) sample size, (c) follow-up month, and (d) HR estimation method. HR: hazard ratio; CI: confidence interval.
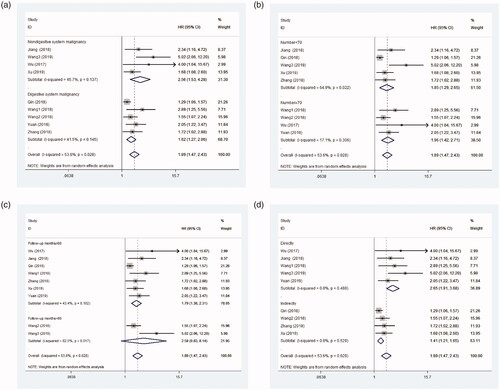
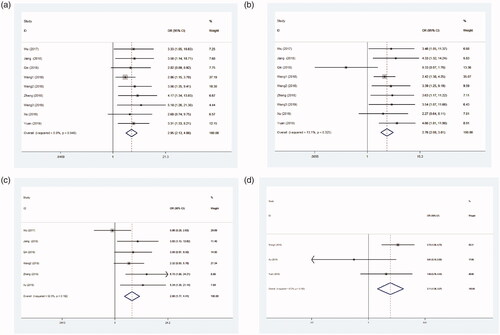
Figure 4. Meta-analysis for the association between LINC01296 expression levels with clinicopathological parameters. The investigated clinicopathological parameters are: (a) clinical stage, (b) lymph node metastasis, (c) tumour size, and (d) differentiation.