Figures & data
Figure 1. The expression patterns of GPR39 in MC3T3-E1 cells. Murine RAW264.7 macrophages were used as a reference. (A) RT-PCR of GPR39; (B) protein levels of GPR39.
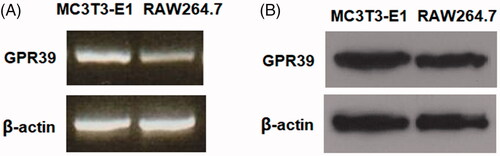
Figure 2. GPR39 was elevated during the process of osteoblast differentiation of pre-osteoblast MC3T3-E1 cells. Cells were cultured with osteogenic medium (OM) for different periods of times. (A). mRNA levels of GPR39; (B). Protein levels of GPR39 (*, #, $, p < .01).
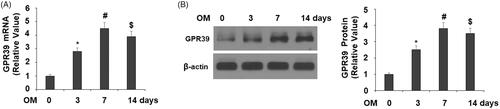
Figure 3. TC-G 1008 stimulated the differentiation and mineralization of MC3T3-E1 cells. Cells were incubated with osteogenic medium (OM) with or without GPR39 agonist TC-G 1008 (10 μM) for 14 days. (A) mRNA levels of ALP, OCN, and Col-I; (B. ALP activity; (C. Alizarin Red S staining (*, #, p < .01).
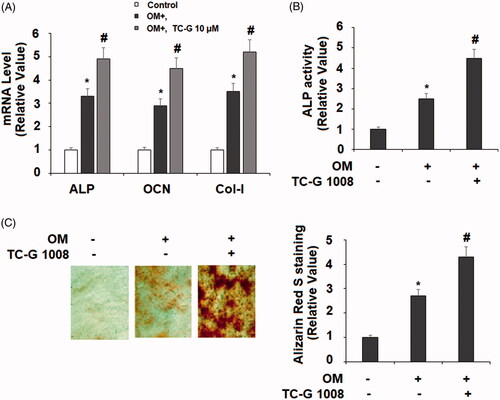
Figure 4. TC-G 1008 increased Runx-2 expression. Cells were incubated with osteogenic medium (OM) with or without GPR39 agonist TC-G 1008 (10 μM) for 14 days. (A) mRNA levels of Runx-2; (B) protein levels of Runx-2 (*, #, p < .01).
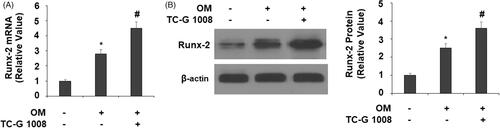
Figure 5. TC-G 1008 increased the phosphorylation of eNOS and the generation of nitric oxide (NO). (A). Cells were stimulated with TC-G 1008 (10 μM) for 0.5, 1 h. Phosphorylated eNOS was measured; (B) cells were stimulated with TC-G 1008 (10 μM) for 3, 6 h. Generation of NO was measured by DAF FM DA (*, #, p < .01).
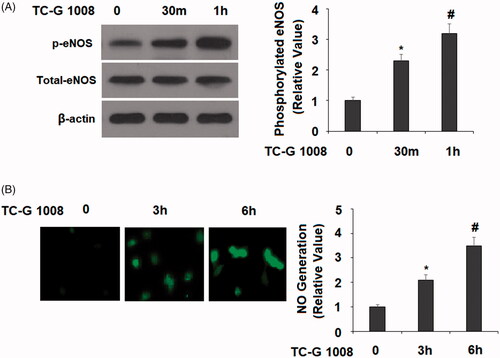
Figure 6. TC-G 1008 increased the phosphorylation of AMPK. MC3T3-E1 cells were stimulated with TC-G 1008 (10 μM) for 0.5, 1 h. Phosphorylated AMPK was measured (*, #, p < .01).
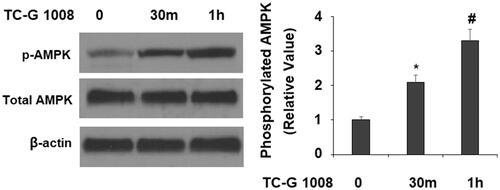
Figure 7. Treatment with the AMPK inhibitor compound C suppressed the effects of TC-G 1008 on the differentiation and mineralization of MC3T3-E1 cells. Cells were incubated with osteogenic medium (OM) and TC-G 1008 (10 μM) with or without compound C (10 μM) for 14 days. (A) mRNA levels of ALP, OCN, and Col-I; (B) ALP activity; (C) Alizarin Red S staining (*, #, p < .01).
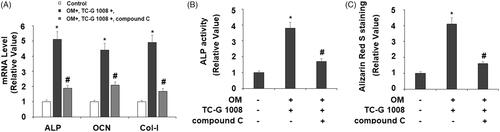
Figure 8. Treatment with the AMPK inhibitor compound C suppressed the effects of TC-G 1008 in Runx-2 expression. Cells were incubated with osteogenic medium (OM) and TC-G 1008 (10 μM) with or without compound C (10 μM). (A) mRNA of Runx-2; (B) protein of Runx-2; (C) NO production (*, #, p < .01).
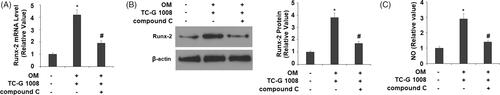
Figure 9. Treatment with the eNOS inhibitor l-NAME suppressed the effects of TC-G 1008 on the differentiation and mineralization of MC3T3-E1 cell. Cells were incubated with osteogenic medium (OM) and TC-G 1008 (10 μM) with or without l-NAME (1 mM). (A). ALP activity; (B). Alizarin Red S staining (C). Expression of RUNX-2 was measured by western blot analysis (*, #, p < .01).
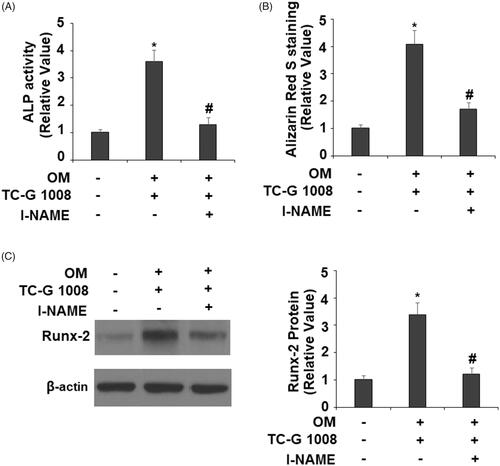
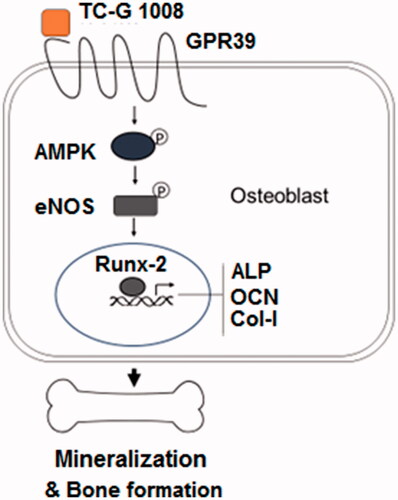
Figure 10. A representative schematic of the molecular mechanisms.