Figures & data
Figure 1. HG stimulation caused increase in ANGPTL-4 expression in MCs. HBZY-1 cells were treated with 5 mM glucose (NG group) or 40 mM glucose (HG group) for different hours. (A) The mRNA level of ANGPTL-4 was measured using qRT-PCR. (B) The protein level of ANGPTL-4 was detected using western blot. *p < .05.
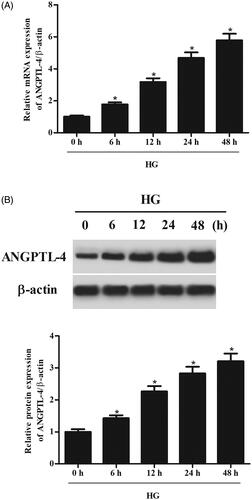
Figure 2. Knockdown of ANGPTL-4 inhibits HG-induced cell proliferation in MCs. HBZY-1 cells were transfected with si-ANGPTL-4 or si-NC, followed by incubation with 5 or 40 mM glucose for 48 h. (A and B) qRT-PCR and Western blot analysis were performed to detect the expression of ANGPTL-4. (C) CCK-8 assay was carried out to measure cell proliferation. *p < .05 compared with NG group; #p < .05 compared with HG + si-NC group.
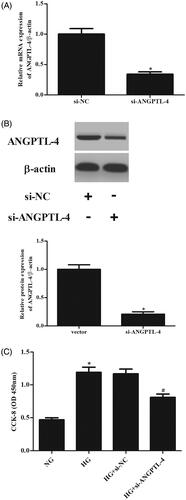
Figure 3. Knockdown of ANGPTL-4 suppresses HG-induced inflammatory response in MCs. After transfection with si-ANGPTL-4 or si-NC and the following incubation with 5 or 40 mM glucose for 48 h, the secretions of TNF-α, IL-1β, IL-6 were determined using ELISA (A–C), respectively. *p < .05 compared with NG group; #p < .05 compared with HG + si-NC group.
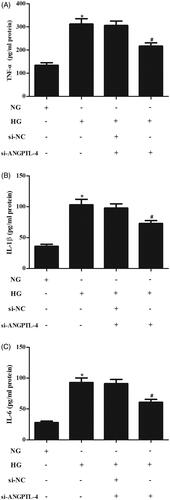
Figure 4. Knockdown of ANGPTL-4 reduces HG-induced production of FN and Col IV in MCs. HBZY-1 cells were incubated with 5 or 40 mM glucose for 48 h after transfection with si-ANGPTL-4 or si-NC. The protein levels and secretions of FN and Col IV were determined using western blot analysis (A and B) and ELISA (C and D), respectively. *p < .05 compared with NG group; #p < .05 compared with HG + si-NC group.
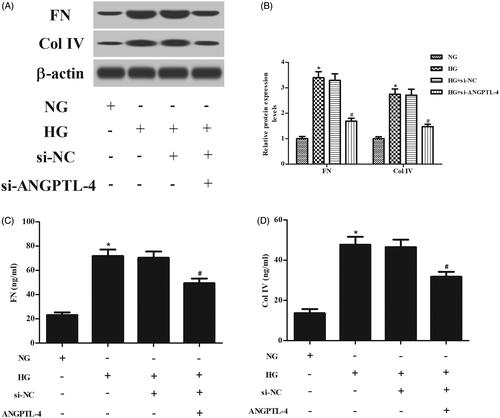
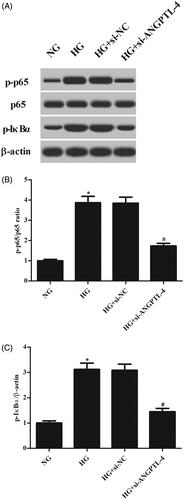
Figure 5. Knockdown of ANGPTL-4 inhibits HG-induced activation of NF-κB pathway in MCs. After indicated treatments, western blot analysis was performed to evaluate the expressions of NF-κB p65, p-p65, IκBα, and p-IκBα in MCs. *p < .05 compared with NG group; #p < .05 compared with HG + si-NC group.