
Figures & data
Figure 1. LPS elicited the cANRIL expression in HK-2 cells. (A) HK-2 cells were exposed in LPS (2 μg/mL) environment for 6 hours. After treating with LPS or not, the expression of cANRIL in HK-2 cells was detected by RT-qPCR. (B) After si-cANRIL transfection, the transfection efficiency was detected by using RT-qPCR. GAPDH was utilized as an internal reference. N = 3. Results were expressed as mean ± SD. ***p < .001.
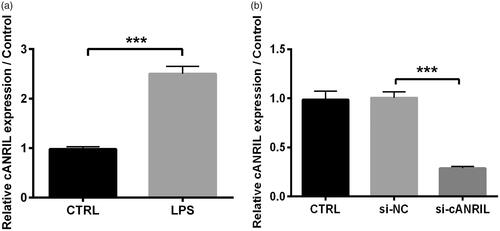
Figure 2. Silencing cANRIL attenuated LPS-induced inflammatory response in HK-2 cells. Cells were transfected with si-cANRIL or the corresponding control (si-NC) and then treated with LPS for 6 hours. (A) Cell viability was examined by CCK-8 assay. (B) Apoptotic cells were counted by flow cytometry. (C) Expression of apoptosis-related proteins (Bcl-2, Bax and cleaved-caspase-3) was measured by western blot. (D) Expression of inflammatory cytokines (IL-1β and IL-6) was measured by western blot. The relative expression of proteins was normalized by β-actin. (E) The content of inflammatory factors (IL-1β and IL-6) in cell cultures were examined by ELISA. (F) ROS generation was assessed by ROS assay. N = 3. Results were expressed as mean ± SD. *p < .05, **p < .01, ***p < .001.
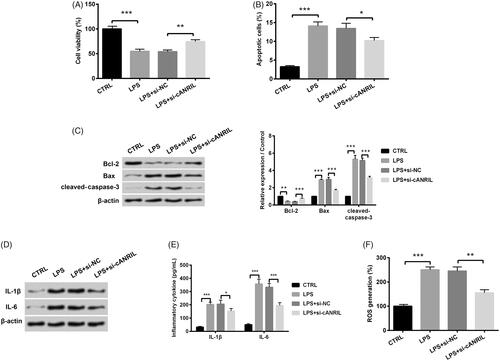
Figure 3. The expression of miR-9 was positively increased by silencing cANRIL in LPS-stimulated HK-2 cells. Cells were transfected with si-cANRIL or the corresponding controls (si-NC) and then were treated with LPS for 6 hours. Next, the relative miR-9 expression was examined by RT-qPCR. U6 served as an internal control. N = 3. Results were expressed as mean ± SD. ***p < .001.
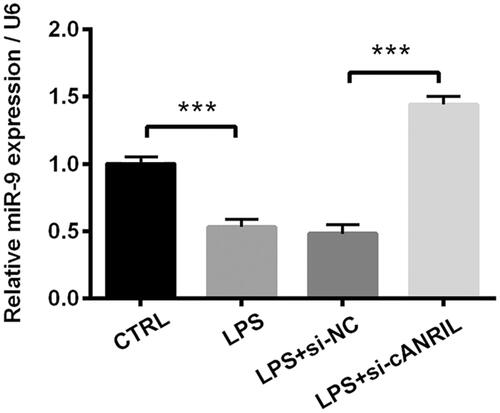
Figure 4. Silencing cANRIL attenuated the LPS-induced inflammatory response via regulating miR-9. (A) After miR-9 inhibitor or NC inhibitor transfection, the miR-9expression was evaluated by RT-qPCR. After si-cANRIL (or miR-9 inhibitor) or the corresponding controls transfection, cells were exposed in LPS solutions for 6 hours. (B) Cell viability was examined by CCK-8 assay. (C) Apoptotic cells were calculated by flow cytometry. (D) The protein expression of Bcl-2, Bax, cleaved-caspase-3 was measured by western blot. (E) The protein expression of IL-1β and IL-6 was measured by western blot. The relative expression of proteins was normalized by β-actin. (F) The inflammatory factors (IL-1β and IL-6) in the cell cultures were examined by ELISA. (G) ROS generation of HK-2 cells was appraised by ROS assay. N = 3. Results were expressed as mean ± SD. *p < .05, **p < .01, ***p < .001.
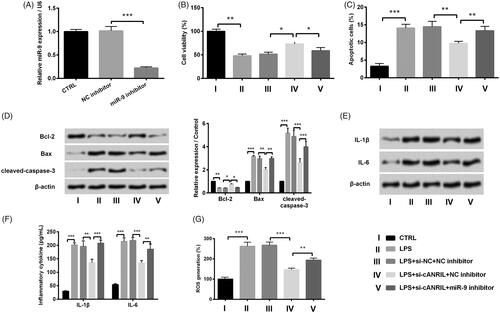
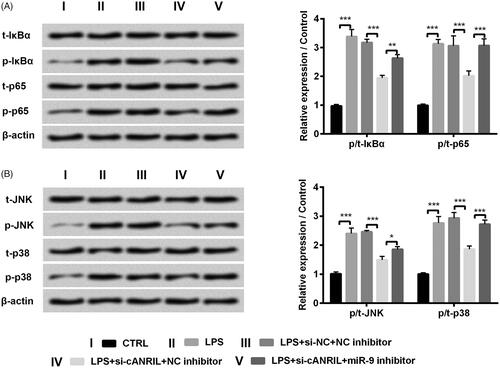
Figure 5. Silencing cANRIL blocked NF-κB and JNK/p38 pathways by positively regulating miR-9 in LPS-treated HK-2 cells. After si-cANRIL (or miR-9 inhibitor) or the corresponding controls transfection, cells were exposed in LPS solutions for 6 hours. (A,B) The protein levels of t-IκBα, p-IκBα, t-p65, p-p65, t-JNK, p-JNK t-p38 and p-p38 were examined by western blot. The relative expression of proteins was normalized by β-actin. N = 3. Results were expressed as mean ± SD. *p < .05, **p < .01, ***p < .001.
Data availability
The datasets used and/or analyzed during the current study are available from the corresponding author on reasonable request.