Figures & data
Figure 1. Hypoxia induced the expression of DPP-4 in cardiac H9C2 cells. Cells were exposed to hypoxia for 12, 24, and 48 h. (A). mRNA levels of DPP-4; (B). Protein levels of DPP-4 (*, #, P < .01 vs. previous group).
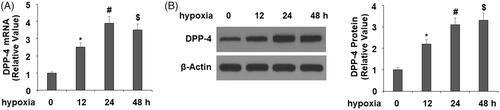
Figure 2. Anagliptin attenuated hypoxia-induced LDH release in cardiac H9C2 cells. Cells were pretreated with anagliptin (10, 20 μM) for 6 h. Then, cells were subjected to hypoxia for 24 h. (A). LDH release from H9C2 cells; (B). Cell viability was measured by MTT assay; (C). Cell morphology of H9C2 cells (*, #, $, P < .01 vs. previous group).
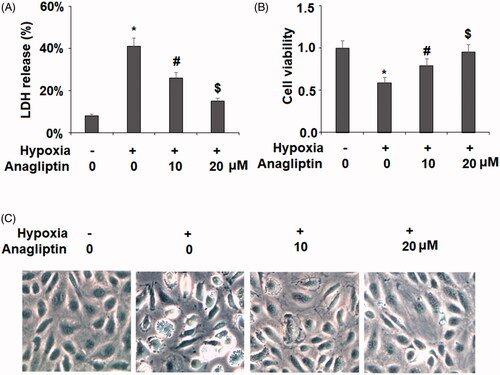
Figure 3. The protective effects of anagliptin against hypoxia-induced apoptosis in H9C2 cells. Cells were pretreated with anagliptin (10, 20 μM) for 6 h, followed by exposure to hypoxia for 24 h. (A). Cell apoptosis was measured by flow cytometric analysis; (B). Quantification of apoptotic cells (*, #, $, P < .01 vs. previous group).
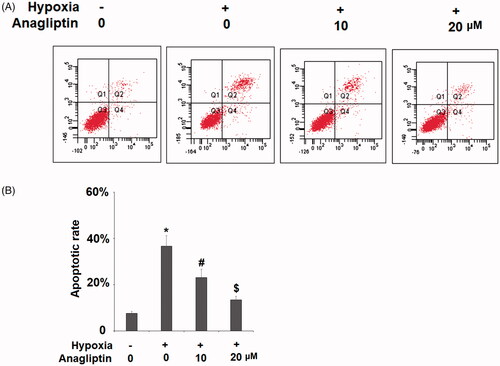
Figure 4. Anagliptin attenuated hypoxia-induced IL-6 and MCP-1 secretion in cardiac H9C2 cells. Cells were pretreated with anagliptin (10, 20 μM) for 6 h. Then, cells were subjected to hypoxia for 24 h. (A) mRNA levels of IL-6 and MPCP-1; (B) Protein levels of IL-6 and MCP-1 (*, #, $, P<.01 vs. previous group).
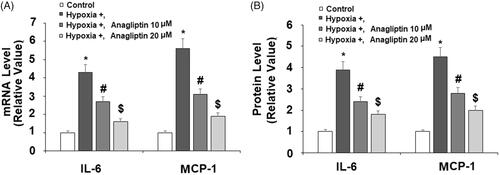
Figure 5. Anagliptin restored hypoxia-induced reduced mitochondrial membrane potential (MMP) in cardiac H9C2 cells. Cells were pretreated with anagliptin (10, 20 μM) for 6 h. Then, cells were subjected to hypoxia for 24 h. Levels of MMP were determined by staining with TMRM (*, #, $, P<.01 vs. previous group).
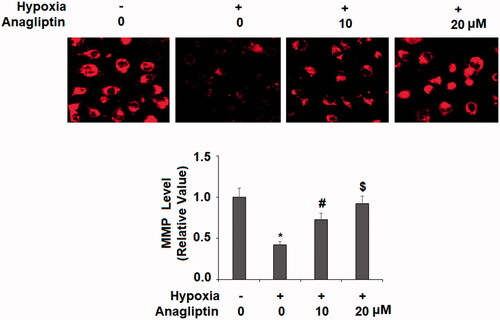
Figure 6. Anagliptin inhibited hypoxia-induced oxidative stress in cardiac H9C2 cells. Cells were pretreated with anagliptin (10, 20 μM) for 6 h. Then, cells were subjected to hypoxia for 24 h. (A) Intracellular ROS was determined by dihydroethidium (DHE) staining; (B) the levels of reduced GSH (*, #, $, P<.01 vs. previous group).
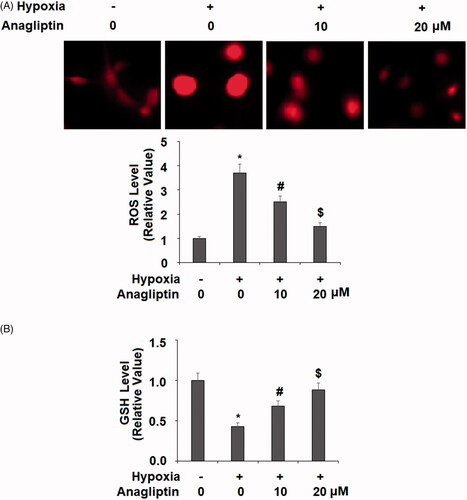
Figure 7. Anagliptin regulates the expression of NRF2 and HO-1. Cells were pretreated with anagliptin (10, 20 μM) for 6 h. Then, cells were subjected to hypoxia for 24 h. (A) mRNA levels of NRF2; (B) protein levels of NRF2; (C) mRNA levels of HO-1; (D) protein levels of HO-1 (*, #, $, P < .01 vs. previous group).
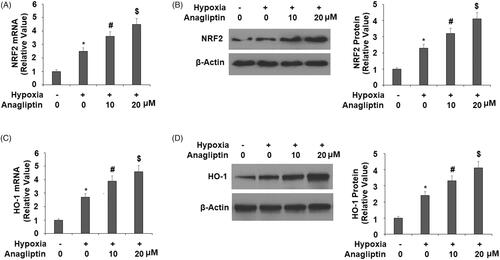
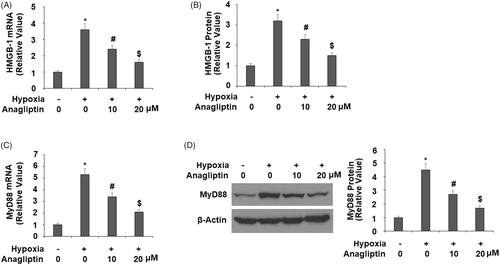
Figure 8. Anagliptin reduced the expression of HMGB-1 and MyD88. Cells were pretreated with anagliptin (10, 20 μM) for 6 h. Then, cells were subjected to hypoxia for 24 h. (A) mRNA levels of HMGB-1; (B) secretions of HMGB-1 as measured by ELISA; (C) mRNA levels of MyD88; (D) protein levels of MyD88 (*, #, $, P<.01 vs. previous group).