Figures & data
Figure 1. (i) XRD analysis of carmustine (Cm) gold co-loaded with PLGA-PSPE nanocomposites and (ii) Thermogravimetric analysis (TGA) of Cm-Au-PLGA-PSPE nanocomposites: (a) PLGA, (b) PLGA-PSPE and (c) Cm-Au-PLGA-PSPE.0.
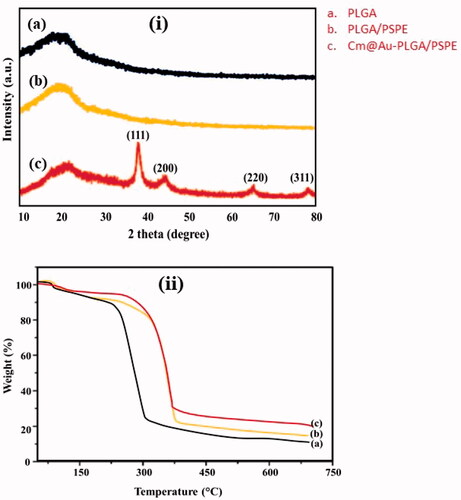
Figure 2. FTIR spectra of carmustine (Cm) gold co-loaded with PLGA-PSPE nanocomposites. (a) PLGA, (b) PLGA-PSPE, (c) Au-PLGA-PSPE, (d) Cm and (e) Cm-Au-PLGA-PSPE.
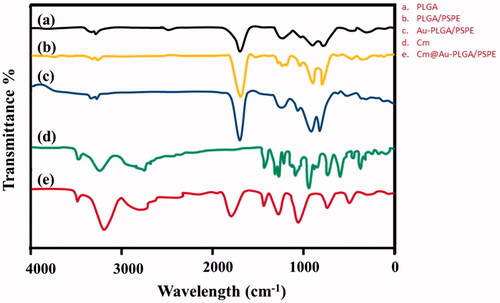
Figure 3. (A) UV-vis spectroscopy of carmustine (Cm) gold co-loaded with PLGA-PSPE nanocomposites recorded at different wavelengths. (B) Dynamic light scattering (DLS) analysis of Cm-Au-PLGA-PSPE showing the particle size of nanocomposites.
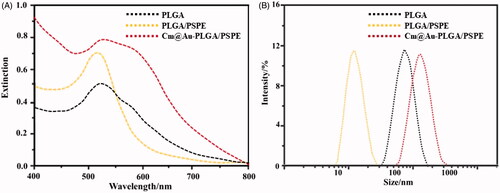
Figure 4. Scanning electron microscopy and transmission electron microscopy of Cm-Au-PLGA-PSPE nanocomposites.
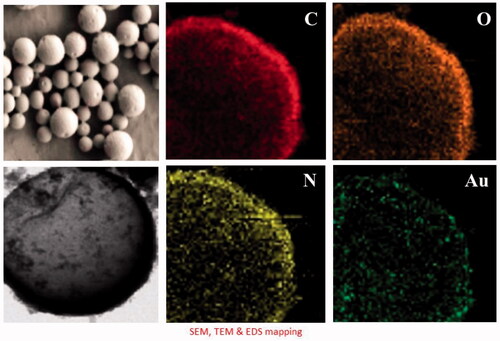
Figure 5. Drug entrapment efficiency (A) and drug release potential (B) of Cm-Au-PLGA-PSPE nanocomposites.
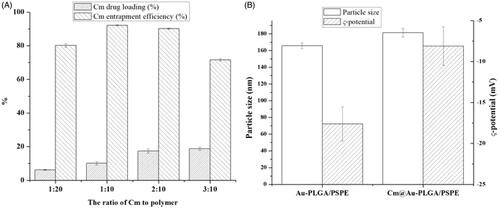
Figure 6. Drug active potential at different temperature (A) and cell viability of U251 human glioma (B) after treatment with Cm-Au-PLGA-PSPE nanocomposites.
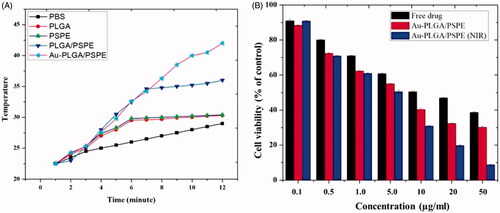
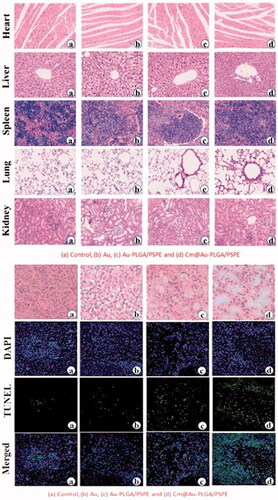
Figure 7. Histopathological examination of normal brain tissues treated with Cm-Au-PLGA-PSPE nanocomposites. (A) treated at 10 μgmL−1 (B) treated at 50 μgmL−1 and (C) treated at 100 μgmL−1.
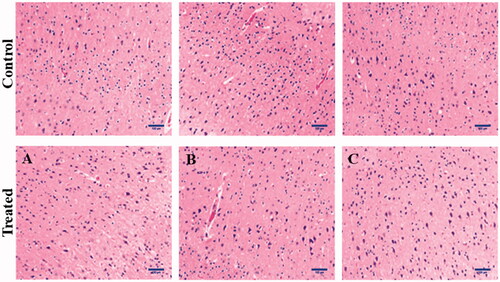
Figure 8. Histopathological examination of human glioma cells treated with Cm-Au-PLGA-PSPE nanocomposites. (A) treated at 10 μgmL−1 (B) treated at 50 μgmL−1 and (C) treated at 100 μgmL−1.
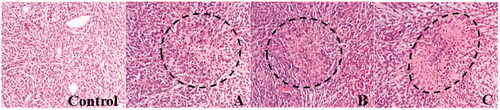
Figure 9. Rate of apoptosis of glioma cells treated with Cm-Au-PLGA-PSPE nanocomposites (i) and flow cytometry of U251 human glioma cells (ii): (A) Control, (B) Au, (C) Au-PLGA/PSPE and (D) Cm@ Au-PLGA/PSPE.
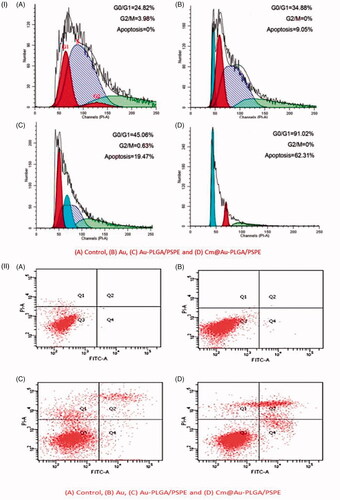
Figure 10. (i) Histopathological examination of mouse wound tissues treated with Cm-Au-PLGA-PSPE nanocomposites. (ii) Light microscopic images showing the wound healing activity in mouse treated with Cm-Au-PLGA-PSPE nanocomposites: (a) Control, (b) Au, (c) Au-PLGA/PSPE and (d) Cm@ Au-PLGA/PSPE.