Figures & data
Figure 1. Oxidative stress promoted the expression of NLRP3 inflammasome and inflammatory factors. Knockdown of NLRP3 and Caspase-1 via transfecting siRNA (A); Western blotting analysis of NLRP3 inflammasome (B); Relative protein expression of NLRP3 inflammasome after treatment with SS-31 and Rotenone (C); Relative protein expression of NLRP3 inflammasome after treatment with NLRP3 siRNA, Caspase-1 siRNA, and YVAD (D); the concentrations of IL-1β and IL-18 in cell supernatant (E). *p<.05 vs. control (Sc siRNA).
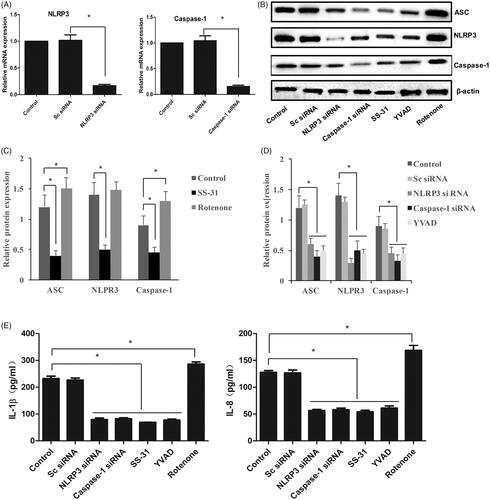
Figure 2. Oxidative stress led to the increase of TRPM2 channel currents and ROS production in the cell. Measurement of ROS production with flow cytometry (A); Quantitative analysis of ROS production after different treatments (B); Measurement of TRPM2 channel current after different treatments (C). *p<.05 vs. control (Sc siRNA).
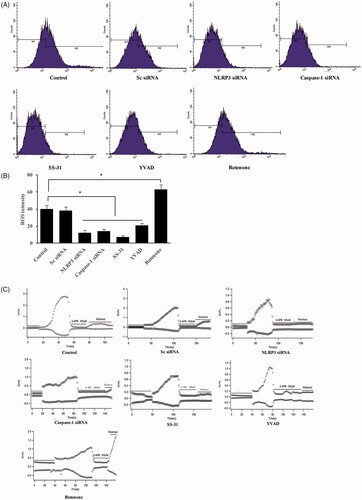
Figure 3. Knockdown of NLRP3 or TRPM2 downregulated the expression of NLRP3 inflammasome and inflammatory factors in vivo. Identification of TRPM2-/- and NLRP3-/- mice with Western blotting method (A); Measurement of IL-1β and IL-18 in serum after normal or high tidal volume mechanical ventilator (B); Measurement of NLRP3 inflammasome protein expression in lung tissue after normal or high tidal volume mechanical ventilator (C); Quantitative analysis of NLRP3 inflammasome protein expression in lung tissue after normal or high tidal volume mechanical ventilator (D). a: WT C57BL/6 mice treated with sham operation; b: WT C57BL/6 mice treated with normal tidal volume ventilation; c: TRPM2-/- mice treated with normal tidal volume ventilation; d: NLRP3-/- mice treated with normal tidal volume ventilation; e: WT C57BL/6 mice treated with high tidal volume ventilation; f: TRPM2-/- mice treated with high tidal volume ventilation; g: NLRP3-/- mice treated with high tidal volume ventilation. * p<.05 vs. control; #p<.05 vs. normal tidal volume ventilation; + p<.05 vs. high-tidal volume ventilation.
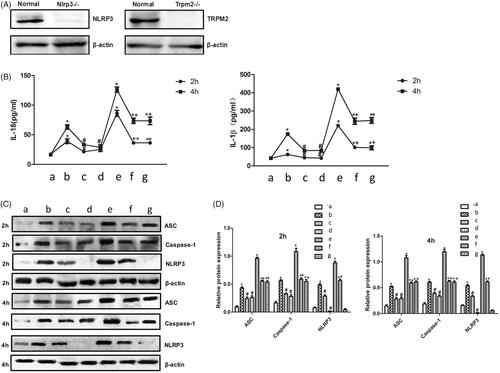
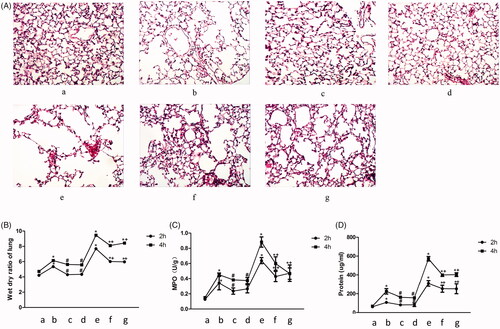
Figure 4. Knockdown of NLRP3 or TRPM2 alleviated the ventilator-induced lung injury. Histological changes of lung tissue stained by HE, infiltration of inflammatory cells were marked with black arrows (A); Measurement of the wet-dry ratio of lung in VILI models (B); Measurement of MPO in VILI models (C); Measurement of BALF protein in VILI models (D). a: WT C57BL/6 mice treated with sham operation; b: WT C57BL/6 mice treated with normal tidal volume ventilation; c: TRPM2-/- mice treated with normal tidal volume ventilation; d: NLRP3-/- mice treated with normal tidal volume ventilation; e: WT C57BL/6 mice treated with high tidal volume ventilation; f: TRPM2-/- mice treated with high tidal volume ventilation; g: NLRP3-/- mice treated with high tidal volume ventilation. *p<.05 vs. control; #p<.05 vs. normal tidal volume ventilation; +p<.05 vs. high tidal volume ventilation.