Figures & data
Figure 1. DRAIC acted as a sponge for miR-122. (A) Potential binding site for miR-122 in DRAIC. (B) DRAIC subcellular location was determined by cytoplasmic and nuclear RNA isolation, followed by qRT-PCR. (C) CNE-1 cell lysates were incubated with biotin-labelled wild type DRAIC or miR-122 binding sites mutated DRAIC; after pull-down, miRNAs were extracted and measured by qRT-PCR. (D) Luciferase activity in CNE-1 cells cotransfected with miR-122 mimics and luciferase reporters containing nothing, DRAIC, or miR-122 binding sites mutated DRAIC. Results are shown as the ratio of firefly luciferase activity to renilla luciferase activity. (E) Luciferase activity in CNE-1 cells cotransfected with miR-122 inhibitors and luciferase reporters containing nothing, DRAIC, or miR-122 binding sites mutated DRAIC. Results are shown as the ratio of firefly luciferase activity to renilla luciferase activity. (F) Anti-AGO2 RIP was performed in CNE-1 cells transiently transfecting miR-122 mimics, followed by qRT-PCR to measure DRAIC associated with AGO2. (G) Anti-AGO2 RIP was performed in CNE-1 cells transiently transfecting miR-122 inhibitors, followed by qRT-PCR to measure DRAIC associated with AGO2. Data represent the mean ± SD of three independent experiments. ns: not significant; *p < .05; **p < .01; ***p < .001.
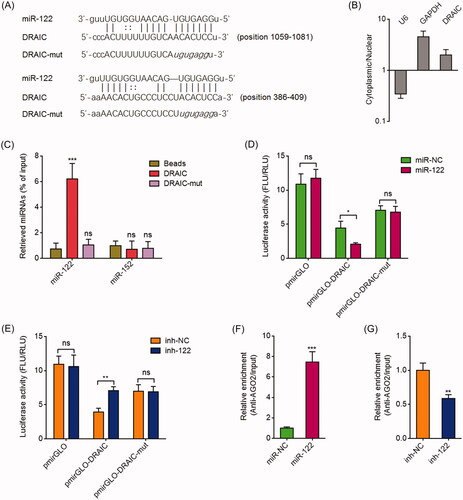
Figure 2. DRAIC upregulated SATB1. (A) Luciferase activity in CNE-1 cells cotransfected with wild type or miR-122 binding sites mutated DRAIC overexpression vectors and luciferase reporters containing nothing or SATB1 3′UTR. Results are shown as the ratio of firefly luciferase activity to renilla luciferase activity. (B) Luciferase activity in CNE-1 cells cotransfected with DRAIC specific shRNAs and luciferase reporters containing nothing or SATB1 3′UTR. Results are shown as the ratio of firefly luciferase activity to renilla luciferase activity. (C) SATB1 mRNA levels in CNE-1 cells transiently transfecting wild type or miR-122 binding sites mutated DRAIC overexpression vectors. (D) SATB1 mRNA levels in CNE-1 cells transiently transfecting DRAIC specific shRNAs. (E) SATB1 protein levels in CNE-1 cells transiently transfecting wild type or miR-122 binding sites mutated DRAIC overexpression vectors. (F) SATB1 protein levels in CNE-1 cells transiently transfecting DRAIC specific shRNAs. SATB1 mRNA and protein levels were measured using qRT-PCR and Western blot, respectively. Data represent the mean ± SD of three independent experiments. ns: not significant; **p < .01; ***p < .001.
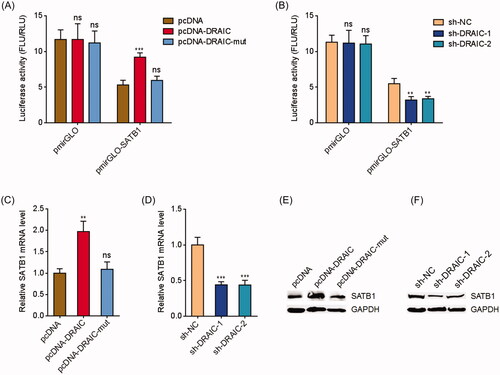
Figure 3. Overexpression of DRAIC promoted NPC cell growth, migration and invasion. (A,B) DRAIC expression in wild type or miR-122 binding sites mutated DRAIC stably overexpressed CNE-1 (A) and C666-1 (B) cells was determined by qRT-PCR. (C,D) Cell proliferation of wild type or miR-122 binding sites mutated DRAIC stably overexpressed CNE-1 (C) and C666-1 (D) cells was determined by CCK-8 assays. (E) Cell proliferation of wild type or miR-122 binding sites mutated DRAIC stably overexpressed CNE-1 and C666-1 cells was determined by EdU incorporation assays. Scale bars, 100 μm. (F) Cell migration of wild type or miR-122 binding sites mutated DRAIC stably overexpressed CNE-1 and C666-1 cells was determined by transwell migration assays. Scale bars, 100 μm. (G) Cell invasion of wild type or miR-122 binding sites mutated DRAIC stably overexpressed CNE-1 and C666-1 cells was determined by transwell invasion assays. Scale bars, 100 μm. Data represent the mean ± SD of three independent experiments. ns: not significant; **p < .01; ***p < .001.
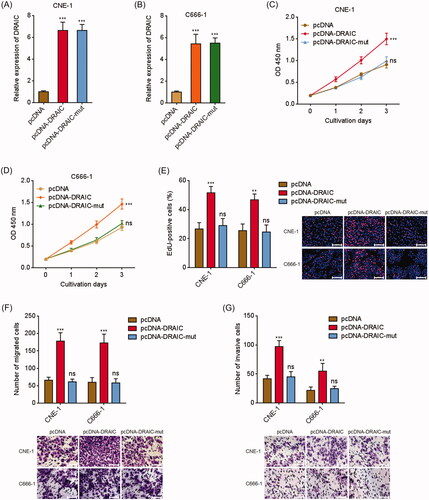
Figure 4. Knockdown of DRAIC inhibited NPC cell growth, migration and invasion. (A,B) DRAIC expression in DRAIC stably depleted CNE-1 (A) and C666-1 (B) cells was determined by qRT-PCR. (C,D) Cell proliferation of DRAIC stably depleted CNE-1 (C) and C666-1 (D) cells was determined by CCK-8 assays. (E) Cell proliferation of DRAIC stably depleted CNE-1 and C666-1 cells was determined by EdU incorporation assays. Scale bars, 100 μm. (F) Cell migration of DRAIC stably depleted CNE-1 and C666-1 cells was determined by transwell migration assays. Scale bars, 100 μm. (G) Cell invasion of DRAIC stably depleted CNE-1 and C666-1 cells was determined by transwell invasion assays. Scale bars, 100 μm. Data represent the mean ± SD of three independent experiments. **p < .01; ***p < .001.
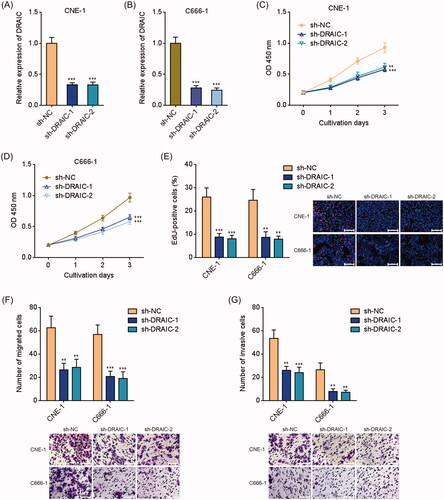
Figure 5. Overexpression of miR-122 reversed the roles of DRAIC on NPC cell growth, migration and invasion. (A,B) miR-122 expression in miR-122 and DRAIC concurrently stably overexpressed CNE-1 (A) and C666-1 (B) cells was determined by qRT-PCR. (C,D) Cell proliferation of miR-122 and DRAIC concurrently stably overexpressed CNE-1 (C) and C666-1 (D) cells was determined by CCK-8 assays. (E) Cell proliferation of miR-122 and DRAIC concurrently stably overexpressed CNE-1 and C666-1 cells was determined by EdU incorporation assays. Scale bars, 100 μm. (F) Cell migration of miR-122 and DRAIC concurrently stably overexpressed CNE-1 and C666-1 cells was determined by transwell migration assays. Scale bars, 100 μm. (G) Cell invasion of miR-122 and DRAIC concurrently stably overexpressed CNE-1 and C666-1 cells was determined by transwell invasion assays. Scale bars, 100 μm. Data represent the mean ± SD of three independent experiments. ns: not significant; **p < .01; ***p < .001.
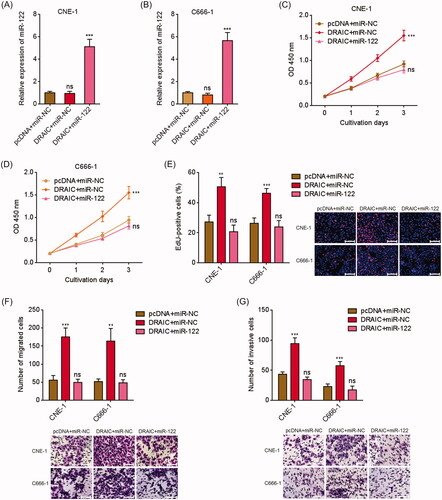
Figure 6. SATB1 knockdown abrogated the roles of DRAIC on NPC cell growth, migration and invasion. (A,B) SATB1 protein levels in DRAIC stably overexpressed and concurrently SATB1 stably depleted CNE-1 (A) and C666-1 (B) cells were determined by Western blot. (C,D) Cell proliferation of DRAIC stably overexpressed and concurrently SATB1 stably depleted CNE-1 (C) and C666-1 (D) cells was determined by CCK-8 assays. (E) Cell proliferation of DRAIC stably overexpressed and concurrently SATB1 stably depleted CNE-1 and C666-1 cells was determined by EdU incorporation assays. Scale bars, 100 μm. (F) Cell migration of DRAIC stably overexpressed and concurrently SATB1 stably depleted CNE-1 and C666-1 cells was determined by transwell migration assays. Scale bars, 100 μm. (G) Cell invasion of DRAIC stably overexpressed and concurrently SATB1 stably depleted CNE-1 and C666-1 cells was determined by transwell invasion assays. Scale bars, 100 μm. Data represent the mean ± SD of three independent experiments. ns: not significant; **p < .01; ***p < .001.
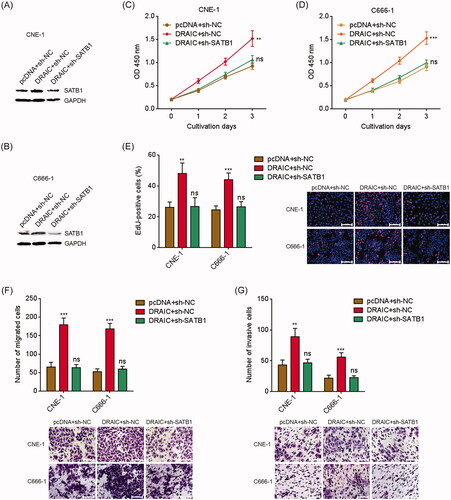
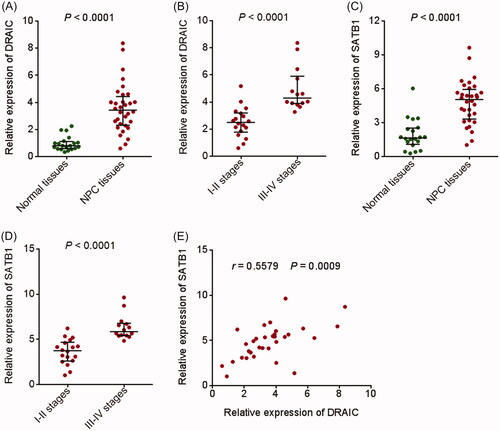
Figure 7. Expression of DRAIC and SATB1 in NPC tissues. (A) DRAIC expression in 32 NPC tissues and 20 normal nasopharyngeal epithelial tissues was determined by qRT-PCR. (B) DRAIC expression in 18 I–II stages NPC tissues and 14 III–IV stages NPC tissues was assessed by qRT-PCR. (C) SATB1 expression in 32 NPC tissues and 20 normal nasopharyngeal epithelial tissues was determined by qRT-PCR. (D) SATB1 expression in 18 I–II stages NPC tissues and 14 III–IV stages NPC tissues was assessed by qRT-PCR. (E) The correlation between DRAIC expression and SATB1 expression in 32 NPC tissues.