Figures & data
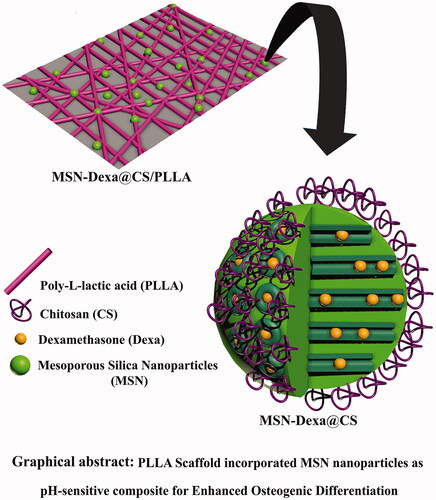
Scheme 1. Schematic representation for the PLLA Scaffold incorporated MSN-Dexa@CS.
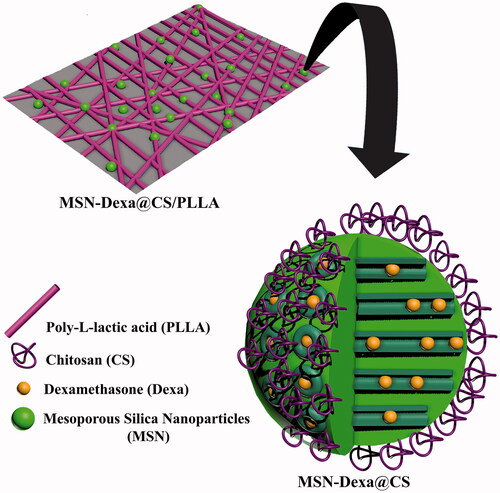
Figure 1. FT-IR spectra of MSN (a) and calcinated MSN (b) (A), XRD pattern of MSN (a) and MSN@CS (b) after the removal of template (B), TGA Thermogram of CS coated MSN (C) and Standard calibration curve of Dexa in DI water (D).
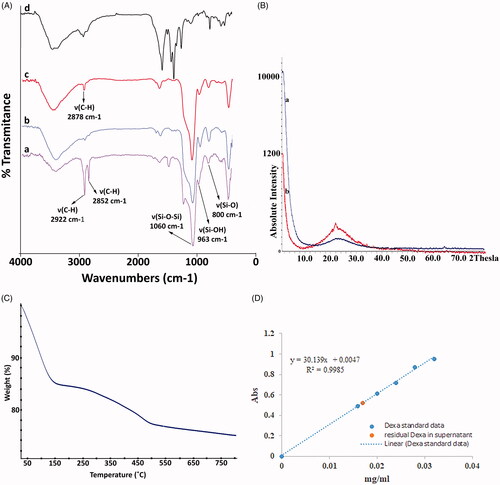
Figure 2. FE-SEM images of MSNs-calcinated (a), MSN@CS (b), TEM images of MSNs-calcinated (c) and MSN@CS (d).
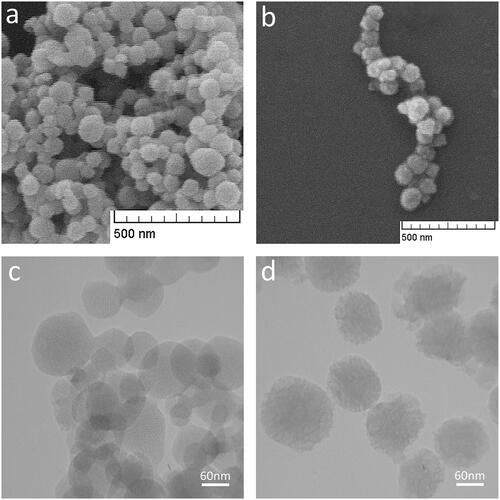
Figure 3. SEM Picture of scaffolds: PLLA (a), MSN-Dexa@CS/PLLA Composite (b).

Figure 4. Tensile strength graph of Pure PLLA and MSN-Dexa@CS/PLLA scaffolds.
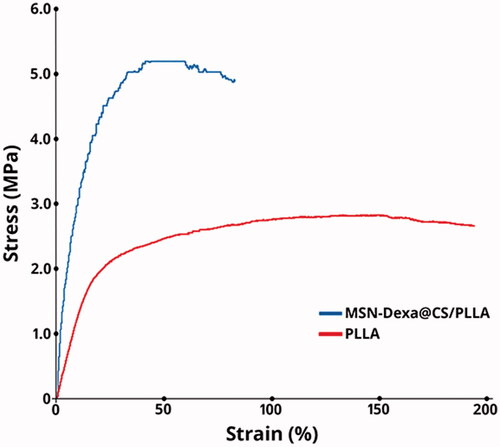
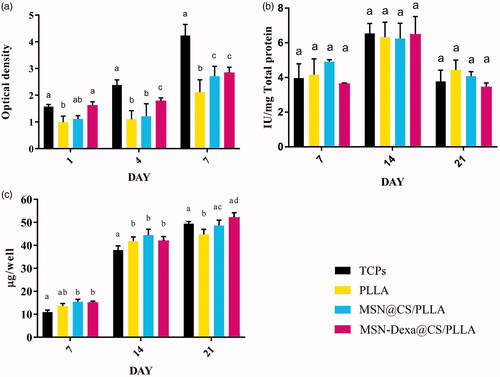
Figure 5. Rate of cell proliferation of MSCs on different scaffolds and TCP (a), ALP activity of MSCs on different scaffolds and TCP (b) and Level of calcium deposition of MSCs on different scaffolds and TCP (c).