Figures & data
Figure 1. The expression of PTEN was down-regulated in RA FLSs. (a) Representative H&E staining of AIA and normal synovial tissues in rat (original magnification, ×20). (b) The expression of PTEN in AIA and normal synovial tissue was analyzed by IHC staining analysis in rats. (c) The expression of PTEN and Vimentin were analyzed by double immunofluorescence staining analysis in rats AIA and normal FLSs. (d) The protein levels of PTEN, TNF-α and IL-6 were analyzed by Western blotting in AIA and normal FLSs. All values were expressed as mean ± SD. ##p < .01 vs. normal group.
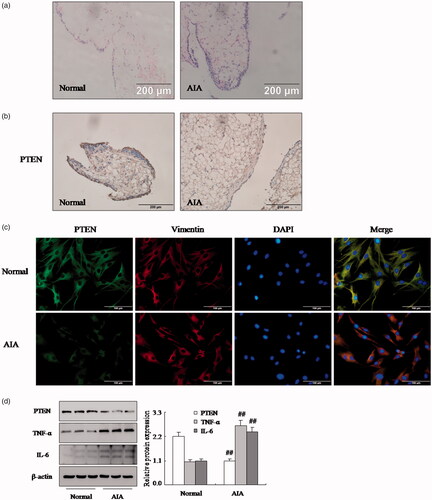
Figure 2. Inhibition of PTEN expression with bpv increases pro-inflammatory cytokines and chemokines of FLSs. (a) The protein levels of PTEN, TNF-α and IL-6 were analyzed by Western blotting in FLSs with bpv in AIA. (b) The mRNA levels of PTEN were analyzed by q-PCR assays with bpv. (c) The q-PCR assays analyzed IL-1β, IL-6 and TNF-α mRNA in FLSs with bpv. (d) After FLSs were incubated with bpv, the mRNA levels of CCL-2, CCL-3 and VCAM-1 were analyzed by q-PCR assays in AIA. (e) FLSs were treated with bpv, the mRNA level of VEGF-α was analyzed by q-PCR assays in AIA. All values were expressed as mean ± SD. ##p < .01 vs. normal group. *p < .05, **p < .01 vs. AIA group.
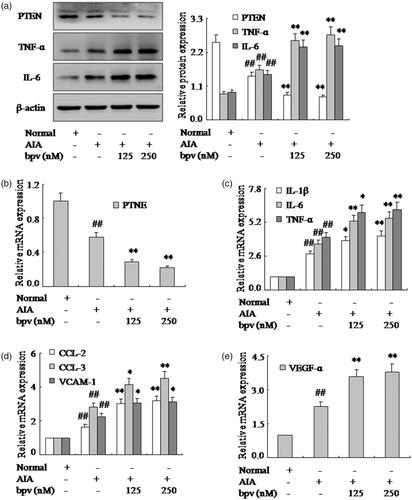
Figure 3. Inhibition of PTEN expression with PTEN-RNAi promotes pro-inflammatory cytokines and chemokines of FLSs. (a) The protein levels of PTEN, TNF-α and IL-6 were analyzed by Western blotting in FLSs with PTEN-RNAi in AIA. (b) The mRNA levels of PTEN were analyzed by q-PCR assays with PTEN-RNAi. (c) The q-PCR assays analyzed IL-1β, IL-6 and TNF-α mRNA in FLSs with PTEN-RNAi. (d) After FLSs were incubated with PTEN-RNAi, the mRNA levels of CCL-2, CCL-3 and VCAM-1 were analyzed by q-PCR assays in AIA. (e) FLSs were treated with PTEN-RNAi, the mRNA level of VEGF-α was analyzed by q-PCR assays in AIA. All values were expressed as mean ± SD. ##p < .01 vs. normal group. *p < .05, **p < .01 vs. AIA group.
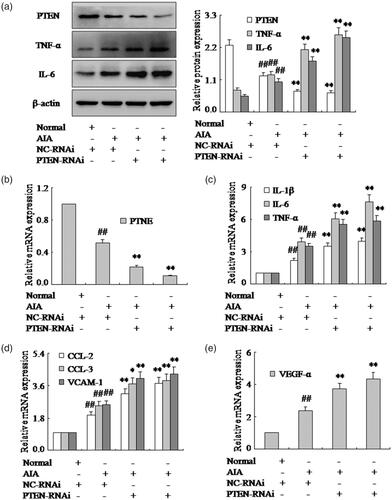
Figure 4. Over expression vector of PTEN expression with PTEN-GV141 inhibits pro-inflammatory cytokines and chemokines of FLSs. (a) The protein levels of PTEN, TNF-α and IL-6 were analyzed by Western blotting in FLSs with PTEN-GV141 in AIA. (b) The mRNA levels of PTEN were analyzed by q-PCR assays with PTEN-GV141. (c) The q-PCR assays analyzed IL-1β, IL-6 and TNF-α mRNA in FLSs with PTEN-GV141. (d) After FLSs were incubated with PTEN-GV141, the mRNA levels of CCL-2, CCL-3 and VCAM-1 were analyzed by q-PCR assays in AIA. (e) FLSs were treated with PTEN-GV141, the mRNA level of VEGF-α was analyzed by q-PCR assays in AIA. All values were expressed as mean ± SD. ##p < .01 vs. normal group. *p < .05, **p < .01 vs. AIA group.
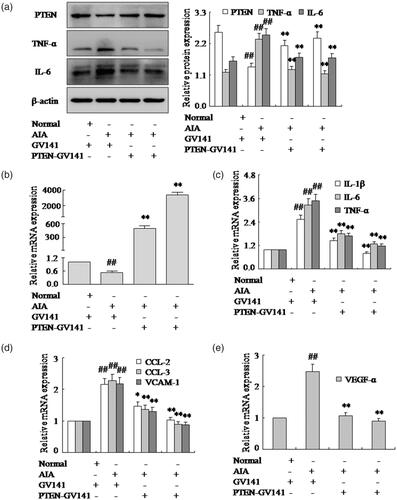
Figure 5. DNA methylation regulates PTEN expression. (a) We projected near the transcript first exon and first exon upstream found four CPG island with CG point rich form rat PTEN gene. (b) The protein level of DNMT1 was analyzed by Western blotting in AIA and normal FLSs. (c) The protein levels of PTEN, TNF-α and IL-6 were analyzed by Western blotting in FLSs with 5-Aza in AIA. (d) The mRNA levels of PTEN were analyzed by q-PCR assays with 5-Aza. (e) The q-PCR assays analyzed IL-1β, IL-6 and TNF-α mRNA in FLSs with 5-Aza. (f) After FLSs were incubated with 5-Aza, the mRNA levels of CCL-2, CCL-3 and VCAM-1 were analyzed by q-PCR assays in AIA. (g) FLSs were treated with 5-Aza, the mRNA level of VEGF-α was analyzed by q-PCR assays in AIA. All values were expressed as mean ± SD. ##p < .01 vs. normal group. *p < .05, **p < .01 vs. AIA group.
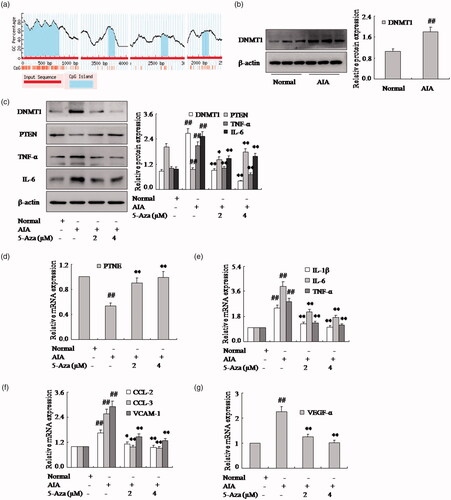
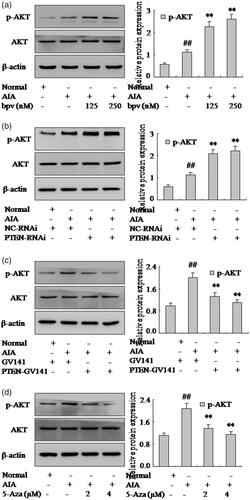
Figure 6. PTEN may modulate FLSs pro-inflammatory cytokines and chemokines and be closely associated with AKT signaling pathway. (a) The protein level of p-AKT was analyzed by Western blotting in FLSs with bpv. (b) The protein level of p-AKT was analyzed by Western blotting in FLSs with PTEN-RNAi. (c) The protein level of p-AKT was analyzed by Western blotting in FLSs with PTEN-GV141. (d) The protein level of p-AKT was analyzed by Western blotting in FLSs with over expression vector 5-Aza. All values were expressed as mean ± SD. #p < .05, ##p < .01 vs. normal group. **p < .01 vs. AIA group.