Figures & data
Figure 1. Cervical cancer tumorsphere cells (TCs) enrichment. (A) Representative images of TCs and differentiated TCs (DTCs). Original magnification × 100. (B) ALDH activity in the HeLa cell line TCs and DTCs. (C) Expressions of stem cell transcription factors (SCTFs): Nanog, Oct4, and Sox2 in TCs and DTCs. (*) denotes differences from the control group (p < .05). Values are means ± standard error of the mean. Three to five samples were available for the analysis in each treatment.
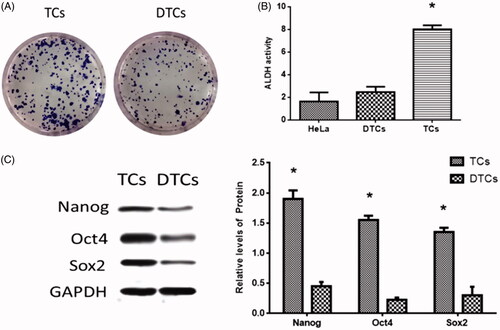
Figure 2. Effects of miR-146a on tumorsphere cells (TCs) colony formation and invasion. (A) MiR-146a expression in TCs and differentiated TCs (DTCs). (B) MiR-146a expression in TCs transfected with miR-146a inhibitor or mimics. (C, D). Effects of miR-146a inhibitor on TCs colony formation and invasion. (E, F). Effects of miR-146a mimics on TCs colony formation and invasion. (*) denotes difference from the control group (p < .05). Values are means ± standard error of the mean. Three to five samples were available for the analysis in each treatment.
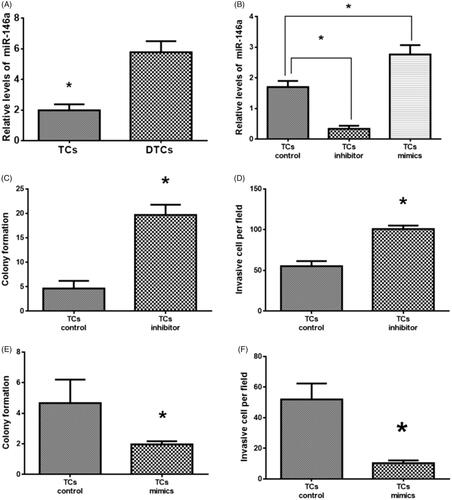
Figure 3. MiR-146a targets vascular endothelial growth factor (VEGF). (A). Prediction of miR-146a binding sequence on the 3’-UTR of VEGF. (B). VEGF expression in tumorsphere cells (TCs) transfected with miR-146a inhibitor or mimics. (C). Relative luciferase activity. (*) denotes difference from the control group (p < 0.05). Values are means ± standard error of the mean. 3–5 samples were available for the analysis in each treatment.
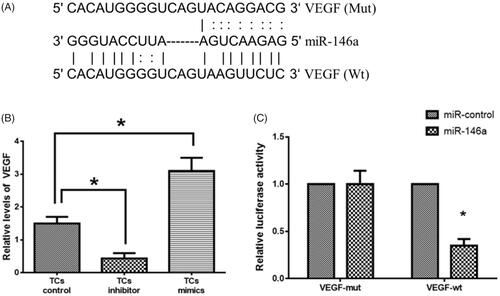
Figure 4. Effects of vascular endothelial growth factor (VEGF) on tumorsphere cells (TCs) colony formation and invasion. (A) VEGF expression in TCs transfected with miR-146a inhibitor and siVEGF, respectively. (B, C) Colony formation and invasion in TCs transfected with miR-146a inhibitor and siVEGF, respectively. (*) denotes difference from the control group (p<.05). Values are means ± standard error of the mean. Three to five samples were available for the analysis in each treatment.
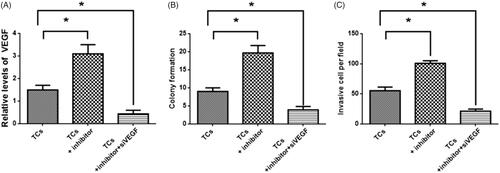
Figure 5. CDC42/PAK1 signaling was involved in tumorsphere cells (TCs) colony formation and invasion. (A) CDC42 and PAK1 expressions in TCs transfected with miR-146a inhibitor. (B) CDC42 and PAK1 expressions in TCs transfected with siVEGF. (C, D) Effects of PAK1 inhibitor, IPA3, in TCs colony formation and invasion. (*) denotes difference from the control group (p < .05). Values are means ± standard error of the mean. Three to five samples were available for the analysis in each treatment.
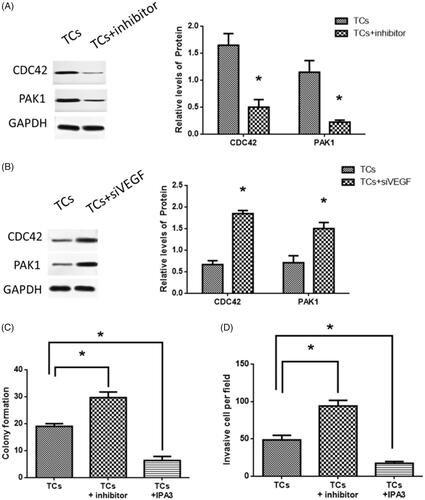
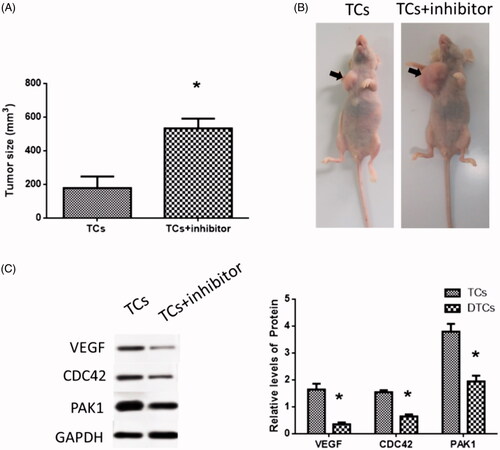
Figure 6. Effects of miR-146a inhibitor in tumor growth in a mouse model. (A) Tumor size. (B) Tumor formation in nude mice. (C) VEGF, CDC42 and PAK1 expressions in a mouse model. (*) denotes difference from the control group (p<.05). Values are means ± standard error of the mean. Three to five samples were available for the analysis in each treatment.