Figures & data
Figure 1. Increased miR-21 expression in HB. (A) miR-21 expression was upregulated in HB cells. (B) miR-21 expression was upregulated in tissues. (C) The correlations between miR-21 expression and patient information. Numbers in parentheses denote the number of samples. (D) The overall survival (OS) rate of patients with HB with high or low miR-21 expression. (*) denotes difference from control (p < .05). Values are means ± SEM. Three samples at least in each treatment group were available for the analysis.
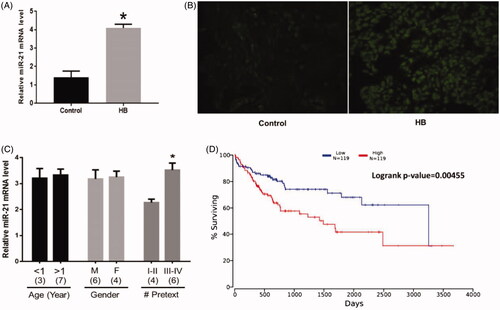
Figure 2. Effects of miR-21 inhibitor on HB apoptosis. (A) miR-21 expression in HB cells transfected with negative control or miR-21 inhibitor. (B) Inhibition of miR-21 increased HB apoptosis. (C) Inhibition of miR-21 affected protein expressions of Bcl-2 and Bax. (D) Inhibition of miR-21 increased protein expressions of caspase-3, 8, 9. (E) Inhibition of miR-21 decreased HB cell migration ability in Transwell assay. (F) Inhibition of miR-21 decreased HB cell invasion ability in invasion assay. (G) Inhibition of miR-21 decreased HB cell migration ability in wound healing assay. (*) denotes difference from control (p < .05). Values are means ± SEM. Three samples at least in each treatment group were available for the analysis.
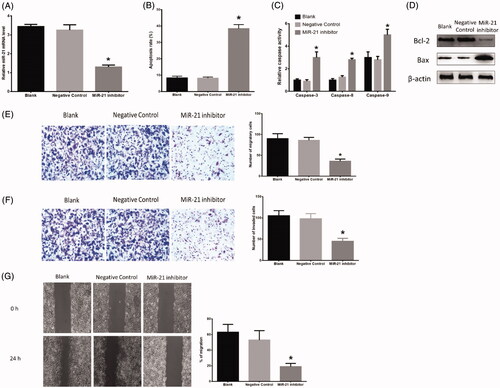
Figure 3. Effects of inhibition of ASPP2 on HB cells. (A) Inhibition of miR-21 increased protein expression of ASPP2. (B) The predictive binding sequence of miR-21 in the 3′UTR of ASPP2 and relative luciferase activity. (C) ASPP2 siRNA treatment decreased protein expression of ASPP2 in HB cells. (D) Inhibition of ASPP2 increased HB cell migration ability in Transwell assay. (E) Inhibition of ASPP2 increased HB cell invasion ability in invasion assay. (F) Inhibition of ASPP2 increased HB cell migration ability in wound healing assay. (*) denotes difference from control (p < .05). Values are means ± SEM. Three samples at least in each treatment group were available for the analysis.
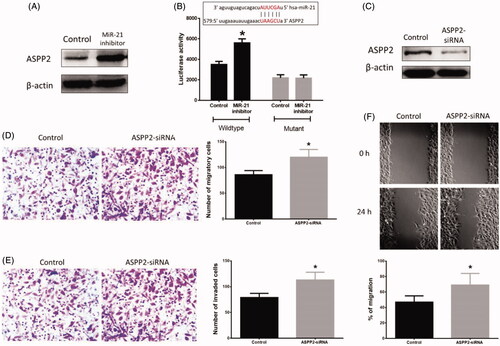
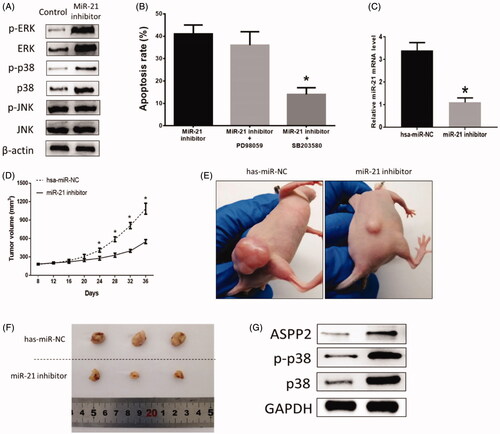
Figure 4. (A) Effects of miR-21 inhibitor on HB apoptosis in vivo. (B) Inhibition of miR-21 affected protein expressions of MAPKs family in vitro. (C) Effects of MAPKs inhibitor on HB apoptosis. (D) Tumor growth curve. (E,F) Representative tumors from mice treated with has-miR-NC or miR-21 inhibitor. (G) Inhibition of miR-21 affected protein expressions of MAPKs family in vivo. (*) denotes difference from control (p < .05). Values are means ± SEM. Three samples at least in each treatment group were available for the analysis.