Figures & data
Table 1. Primers for real-time PCR.
Figure 1. M19 improves dexamethasone-induced apoptosis of osteobalsts. MC3T3-E1 cells (A) and primary osteoblasts (B) were pretreated with different doses of M19 (1, 2 and 4 µM) or vehicle (Veh, DMSO) for 1 h, and then exposed to 1 µM dexamethasone (DEX) for 48 h. Cell apoptosis was assessed by Annexin V/PI staining and flow cytometry analysis. Cells treated with vehicle (Veh, DMSO) only were used as negative control. All data are presented as the mean ± standard deviation. n = 3 independent experiments. ***p < .001 vs. Veh; ###p < .001 vs. Veh + DEX; +++p < .001 vs. 1 µM M19 + DEX; -p < .05 vs. 2 µM M19 + DEX.
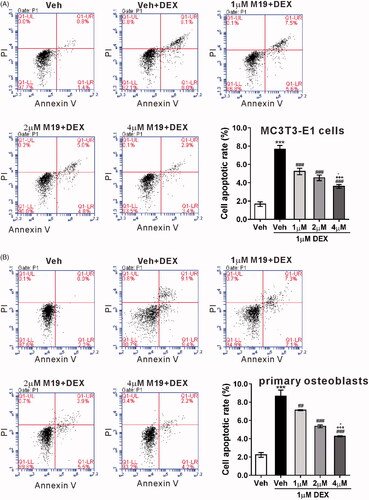
Figure 2. M19 induces p53 ubiquitination in dexamethasone-treated MC3T3-E1 cells. (A, B) MC3T3-E1 cells were pretreated with different doses of M19 (1, 2 and 4 µM) or vehicle (Veh, DMSO) for 1 h, and then exposed to 1 µM dexamethasone (DEX) for 48 h. Cells treated with vehicle (Veh, DMSO) alone were used as negative control. p53 protein (A) and mRNA expression (B) were evaluated by western blotting and real-time PCR, respectively. Representative blots from three experiments are shown. All data are presented as the mean ± standard deviation. n = 3 independent experiments. ***p < .001 vs. Veh; #p < .05, ###p < .001 vs. Veh + DEX; +p < .05, +++p < .001 vs. 1 µM M19 + DEX; -p < .05 vs. 2 µM M19 + DEX. (C) MC3T3-E1 cells were pretreated with 4 µM M19 or vehicle (Veh, DMSO) for 1 h, and then exposed to 1 µM DEX for 48 h. p53 ubiquitination was analyzed by immunoprecipitation (IP) with an anti-p53 antibody followed by immunoblotting using anti-Ub.
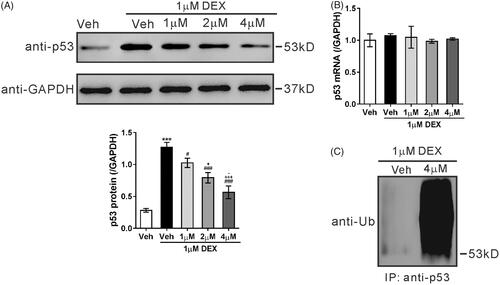
Figure 3. USP14 is a potential deubiquitinase for p53. (A) MC3T3-E1 cells were exposed to 1 µM dexamethasone (DEX) or vehicle (Veh, DMSO) for 48 h. mRNA levels of USP family proteins were detected by real-time PCR. n = 3 independent experiments. *p < .05, **p < .01 vs. Veh. (B) MC3T3-E1 cells were pretreated with different doses of M19 (1, 2 and 4 µM) or vehicle (Veh, DMSO) for 1 h, and then exposed to 1 µM DEX for 48 h. Cells treated with vehicle (Veh, DMSO) only were used as negative control. USP14 protein expression was detected by western blotting. Representative blots from three experiments are shown. n = 3 independent experiments. ***p < .001 vs. Veh; ##p < .01, ###p < .001 vs. Veh + DEX; (C) MC3T3-E1 cell lysate was immunoprecipitated (IP) with anti-USP14 (upper panel) and anti-p53 (lower panel), and immunoblotted with anti-USP14 and anti-p53. IgG was used as a negative control (D) MC3T3-E1 cells were treated with 50 μM IU1 or vehicle (Veh, DMSO) for 48 h. Cell lysates were prepared, IP with anti-p53 or IgG and the immunoblotted with anti-Ub.
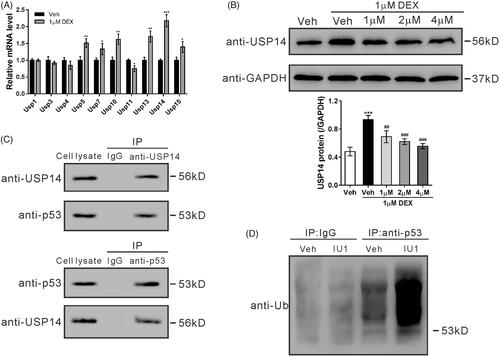
Figure 4. Upregulation of USP14 and p53 contributes to dexamethasone-induced apoptosis of MC3T3-E1 cells. MC3T3-E1 cells were pretreated with vehicle (Veh, DMSO), 25 μM IU1, 50 μM IU1, or 20 μM PFT-α for 1 h, and then with 1 µM dexamethasone (DEX) for 48 h. (A) Cell apoptosis was analyzed by flow cytometry. (B) Protein levels of p53, Bcl-2 and Bax were detected by western blotting. Representative blots from three experiments are shown. n = 3 independent experiments. ***p < .001 vs. Veh; #p < .05, ##p < .01, ###p < .001 vs. Veh + DEX.
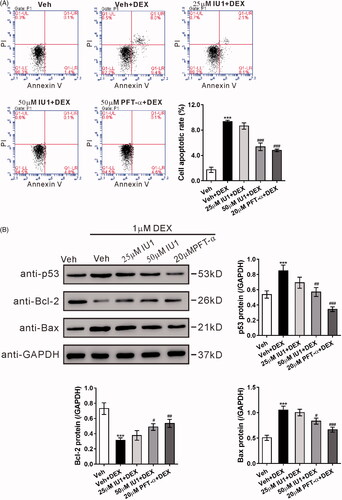
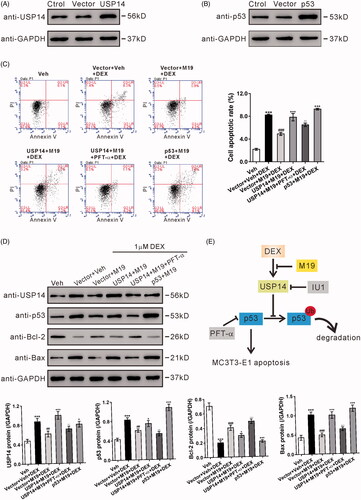
Figure 5. Overexpression of USP14 attenuates the protective effect of M19 in dexamethasone-treated MC3T3-E1 cells by regulating p53. (A, B) MC3T3-E1 cells were transduced with lentivirus overexpressing USP14 (A), p53 (B) or vector for 48 h. The overexpression of USP14 and p53 was confirmed by western blotting. (C, D) MC3T3-E1 cells were transduced with lentivirus overexpressing USP14, p53 or vector for 24 h, treated with vehicle (Veh, DMSO) or 4 µM M19 or 4 µM M19 plus 20 μM PFT-α for 1 h, and then exposed to 1 µM dexamethasone (DEX) for 48 h. Cell apoptosis (C) was analyzed by flow cytometry. Protein levels of p53, Bcl-2 and Bax (D) were detected by western blotting. Representative blots from three experiments are shown. Three independent experiments were conducted. ***p < .001 vs. Veh; ##p < .01, ###p < .001 vs. Vector + Veh + DEX; +p < .05, +++p < .001 vs. Vector + M19 + DEX; --p < .01, ---p < .001 vs. USP14 + M19 + DEX. (E) Schematic representation of the regulation of MC3T3-E1 apoptosis by dexamethasone.