Figures & data
Table 1. Genes and their primer sequences used in qRT-PCR.
Figure 1. OPN is overexpressed in rat BRL-3A liver cells and primary hepatocytes, and induced cell cycle progression of BRL-3A cells (A-E) and primary hepatocytes (F-J). (A) Immunofluorescence assay observed the distribution and expression intensity of OPN in different groups at 48 h after positive monoclonal BRL-3A cell lines from different groups were seeded. (B) RT-PCR and (C) western blot assays measured the expression levels of OPN in BRL-3A cells at 48 h after seeding. (D) MTT detected the effects of OPN on cell viability of BRL-3A cells at 24, 48 and 72 h after seeding. (E) Flow cytometry analysis detected the effects of OPN on cell cycle distribution of BRL-3A cells at 48 h. (F) Rat primary hepatocytes were cultured and differentially transfected with Ad-RFP and Ad-OPN. Visual inspection showed high transfection efficiency by using bright field (left panel) and fluorescence (right panel) microscopy at 24 h after adenoviral infection. (G) WB analysis showed OPN protein expression levels in Ad-RFP and Ad-OPN groups at 48 h after transfection. (H) CCK8 assay detected the effects of OPN on hepatocyte viability at 24, 48 and 72 h after transfection. (I) Ki67 immunofluorescence staining analyzed the effects of OPN on the proliferation of primary hepatocytes at 48 h after transfection. (J) Flow cytometry analysis indicated the effects of OPN on cell cycle distribution of primary hepatocytes at 48 h after transfection. The data are presented as mean ± SEM. All scale bar = 50 μm. *p < .05, **p < .01 vs Lenti-GFP group, #p < .05, ##p < .01 vs Ad-RFP group.
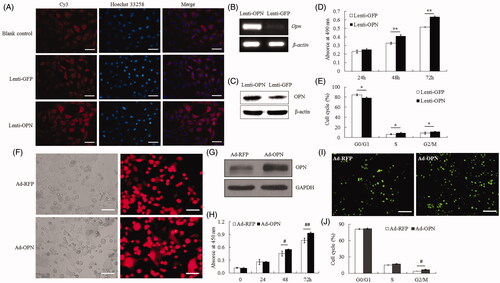
Figure 2. OPN is knocked down in rat BRL-3A cells (A-D) and primary hepatocytes (E-J), and their proliferation were both inhibited. (A) qRT-PCR analysis and agarose gel electrophoresis showed suppression efficiency of the two siRNAs on mRNA level of OPN in BRL-3A cells at 24 h after transfection. (B) MTT assay detected the effects of selected OPN-siRNA (siRNA2) on the viability of BRL-3A cells at 24, 48 and 72 h after transfection. (C) FCM analysis showed the effects of selected OPN-siRNA on cell cycle distribution of BRL-3A at 48 h after treatment. (D) BrdU incorporation assay presented the inhibitory effects of selected OPN-siRNA on BRL-3A proliferation at 48 h after treatment. Rat primary hepatocytes were cultured and differentially transfected by adenovirus (Ad-scramble and Ad-shOPNs), and qRT-PCR (E) and WB (F) analysis showed that the efficiency of Ad-shOPNs on OPN expression at 24 and 48 h after transfection was suppressed, respectively. (G) Visual inspection showed a high transfection efficiency at 24 h in Ad-scramble and Ad-shOPN groups under bright field (left panel) and fluorescence (right panel) microscopy. (H) CCK8 assay detected the effects of Ad-shOPN on hepatocyte viability at 24, 48 and 72 h after transfection. (I) Ki67 immunofluorescence staining demonstrated the effects of Ad-shOPN on the proliferation of primary hepatocytes at 48 h after transfection. (J) FCM analysis indicated that the effects of Ad-shOPN on cell cycle distribution of primary hepatocytes at 48 h after transfection. The data are presented as mean ± SEM. All scale bar = 50 μm. *p < .05 vs scramble group, #p < .05, ##p < .01 vs Ad-scramble group.
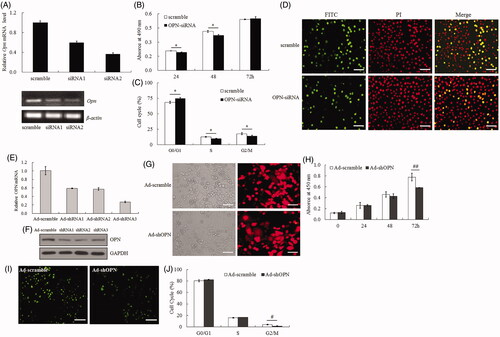
Table 2. The impact of OPN-siRNA treatment on proliferation of BRL-3A rat liver cells.
Figure 3. Endogenous OPN affected the activation AKT and STAT3 signaling pathways. (A) Western blots (left panel) and corresponding densitometry (right panel) showed up-regulated expressions of p-STAT3, p-AKT, and CCND1 (left panel) in Lenti-OPN group at 48 h after positive monoclonal BRL-3A cell lines were seeded. *p < .05, **p < .01 vs Lenti-GFP group. (B) Western blots (left panel) and corresponding densitometry (right panel) analysis showed the expressions of p-STAT3, p-AKT, and CCND1 in BRL-3A cells at 48 h after transfection with OPN-siRNA. #p < .05 vs scramble group. (C) qRT-PCR analyzed the expression of Ccnd1 gene in BRL-3A at 48 h after Lenti-OPN and Lenti-GFP were seeded or transfected with OPN-siRNA. ††p < .01 vs respective control group. The data are presented as mean ± SEM, and β-actin was used as a loading control.
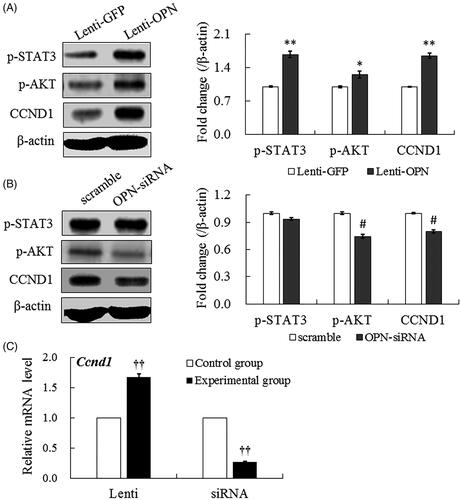
Figure 4. Effect of OPN on the growth of BRL-3A liver cell line. (A) MTT results showed the effects of rrOPN on cell viability. (B) Representative flow cytometry results indicated the roles of rrOPN in cell cycle distribution after treatment for 72 h. (C) MTT assay showed the effect of OPN-Ab on cell viability. (D) Representative FCM analysis indicated the effect of OPN-Ab on cell cycle distribution after treatment for 48 h. The data are presented as mean ± SEM. *p < .05, **p < .01 vs respective control group.
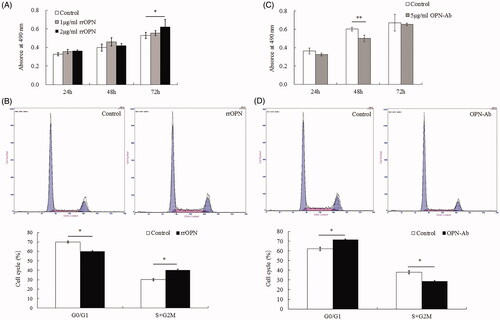
Figure 5. Effect of exogenous OPN on the activation of STAT3 and AKT signaling pathways in BRL-3A cells after treatment with rrOPN for 72 h or OPN-Ab for 48 h. (A) Western blot and corresponding densitometry results showed the expression changes of p-STAT3, p-AKT, BCL2 and BAX proteins. (B) qRT-PCR analyzed the expression changes of Bcl2 and Bax genes. *p < .05, **p < .01 vs respective control group. β-actin was used as a loading control, and the data are shown as mean ± SEM.
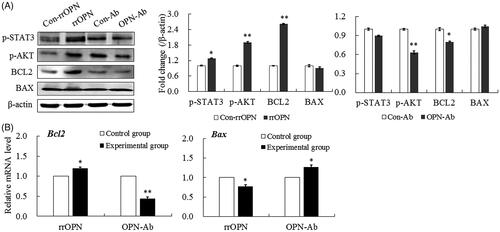
Figure 6. LY294002 suppressed the activation of AKT signaling pathway. Western blots (upper panel) and corresponding densitometry result (low panel) revealed the expressions of p-AKT, BCL2 and BAX proteins in BRL-3A cells after treatment with PI3K/Akt inhibitor LY294002 alone or in combination of LY294002 and OPN-Ab. β-actin was used as a loading control. The data are presented as mean ± SEM. *p < .05, **p < .01 vs control group, #p < .05 vs OPN-Ab alone-treated group, †p < .05 vs LY294002 alone-treated group.
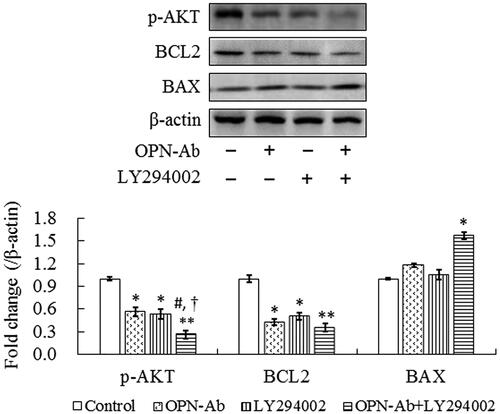
Figure 7. Effects of rrOPN administration on rat LR and hepatocyte proliferation (n = 5). (A) The LR rate was shown at 3, 24 and 72 h after PH. (B) Histogram analysis of immunofluorescence staining showed the expression of Ki-67 in liver tissues at 3, 24 and 72 h after PH. (C) Representative results of immunofluorescence staining indicated the expression of Ki-67 in liver tissues at 72 h after PH. Serum IL-6 and TNF-α levels were determined by ELISA (D), and the expressions of IL-6 and TNF-α in liver tissues were detected by qRT-PCR (E) and WB (F). (G) Serum ALT and AST activities were determined at 3, 24 and 72 h after PH. (H) Histopathological changes were detected by HE staining. The data are presented as mean ± SEM. All scale bar = 50 μm. *p < .05, **p < .01 vs PBS-treated group.
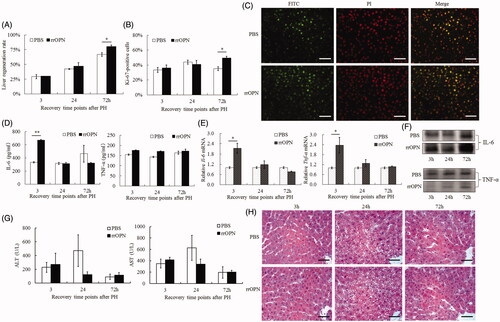
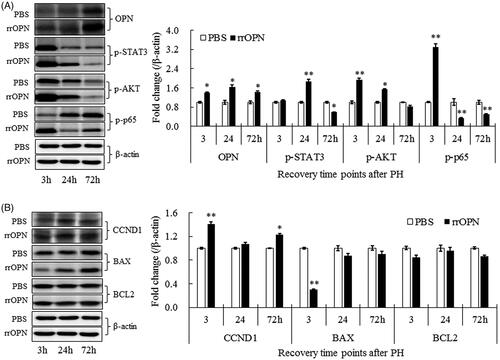
Figure 8. rrOPN significantly activated the downstream STAT3, AKT and NF-κB signaling pathways in LR. Western blotting displayed the expression changes of OPN, p-STAT3, p-AKT, and p-p65 (A) and target proteins including CCND, BAX and BCL2 (B) in LR from rrOPN or PBS-administrated group at 3, 24 and 72 h after PH. Right panel, the graph of average expression data was normalized to β-actin. The data are presented as mean ± SEM. *p < .05, **p < .01 vs PBS-treated group.