Figures & data
Figure 1. CTRP3 expressions in clinical vitreous samples. The mRNA expression levels of CTRP3 in vitreous samples collected from patients with DR or cataract were measured using qRT-PCR. *p < .05 vs. control.
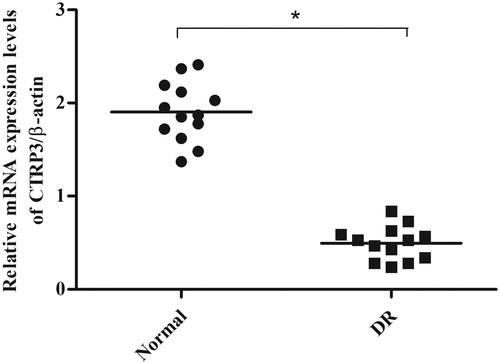
Figure 2. CTRP3 expression in ARPE-19 cells under HG condition. ARPE-19 cells were cultured in normal glucose condition (5.5 mmol/l d-glucose) or HG condition (25 mmol/l d-glucose) for 24 h. The mRNA and protein levels of CTRP3 were determined using qRT-PCR (A) and western blot (B), respectively. *p < .05 vs. control.
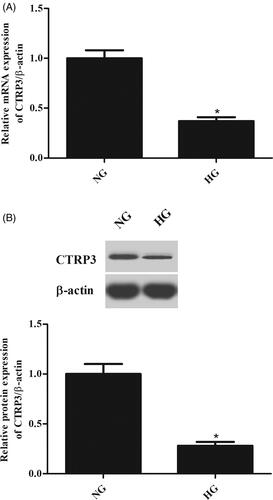
Figure 3. Effect of CTRP3 overexpression on cell viability in HG-induced ARPE-19 cells. ARPE-19 cells were transfected with pcDNA3.1-CTRP3 or control plasmid pcDNA3.1 for 24 h and then subjected to HG condition (25 mmol/l d-glucose) for 24 h. (A,B) The expression levels of CTRP3 were determined using qRT-PCR and western blot. *p < .05 vs. cells transfected with pcDNA3.1. (C) MTT assay was performed to evaluate cell viability. *p < .05 vs. control, #p < .05 vs. HG + pcDNA3.1 group.
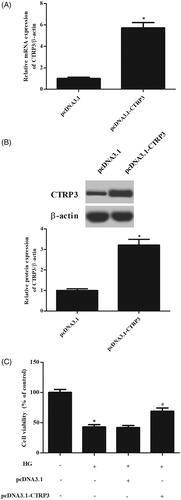
Figure 4. Effect CTRP3 overexpression on HG-induced oxidative stress in ARPE-19 cells. ARPE-19 cells were transfected with pcDNA3.1-CTRP3 or control plasmid pcDNA3.1 for 24 h and then subjected to HG condition (25 mmol/l d-glucose) for 24 h. ROS generation (A), MDA production (B) and SOD activity (C) were measured to assess oxidative stress in ARPE-19 cells. *p < .05 vs. control, #p<.05 vs. HG + pcDNA3.1 group.
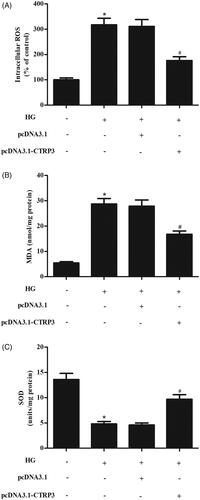
Figure 5. Effect of CTRP3 overexpression on HG-induced cell apoptosis in ARPE-19 cells. ARPE-19 cells were transfected with pcDNA3.1-CTRP3 or control plasmid pcDNA3.1 for 24 h and then subjected to HG condition (25 mmol/l d-glucose) for 24 h. (A) Flow cytometry was applied to examine apoptotic rate of ARPE-19 cells. (B) Western blot was used for the semi-quantitative assessment of the expressions of bax and bcl-2. *p < .05 vs. control, #p < .05 vs. HG + pcDNA3.1 group.
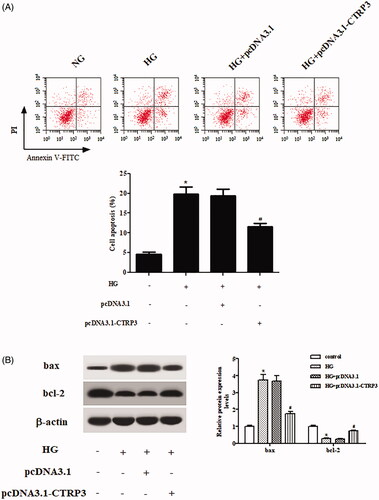
Figure 6. Effect of CTRP3 overexpression on Nrf2/HO-1 pathway in HG-stimulated ARPE-19 cells. (A) Western blot was used for the semi-quantitative assessment of the expressions of nuclear Nrf2 and HO-1. (B, C) The relative intensities of nuclear Nrf2 and HO-1 were determined. *p < .05 vs. HG + pcDNA3.1 group.
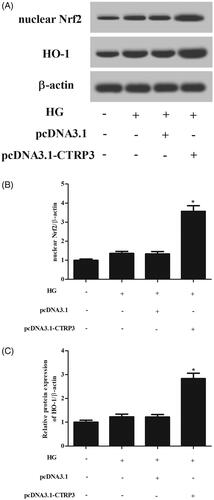
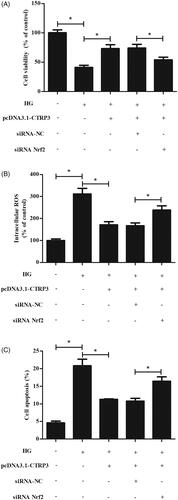
Figure 7. Nrf2 knockdown reversed CTRP3-mediated oxidative stress and apoptosis. ARPE-19 cells were co-transfected with pcDNA3.1-CTRP3 and siRNA-Nrf2 for 24 h and then subjected to HG condition (25 mmol/l d-glucose) for 24 h. (A) MTT assay was performed to evaluate cell viability. (B) ROS production was measured using DCFH-DA. (C) Cell apoptosis was quantified by flow cytometry using an Annexin V-FITC/PI double staining assay kit. *p < .05.