
Figures & data
Figure 1. The survival curve of HNE-1 cells after treatment with different concentrations of Junduqing extractive which was determined by CCK-8 assay. The IC50 of Junduqing extractive in HNE-1 cells was 2.99 mg/ml.
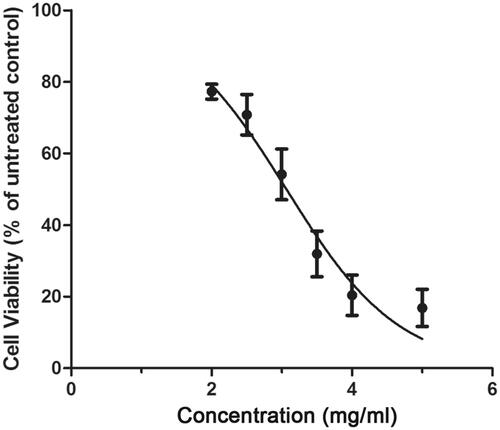
Figure 2. The viability of HNE-1, HNE-2 and HONE1 cells in various groups which was examined by CCK-8 assay. Cells were cultured in the medium containing 1.0, 2.0 and 3.0 mg/ml of Junduqing extractive for various times. *p < .05 vs. Control; #p < .05 vs. 2.0 mg/ml.
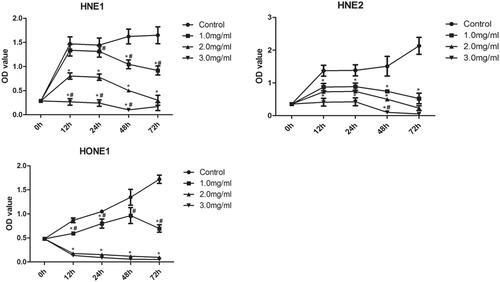
Figure 3. The apoptosis of HNE-1, HNE-2 and HONE1 cells in various groups which was assessed by Annexin V-FITC/PI staining. Cells were cultured in the medium containing 1.0, 2.0 and 3.0 mg/ml of Junduqing extractive for 24 h. *p < .05 vs. Control; #p < .05 vs. 2.0 mg/ml.
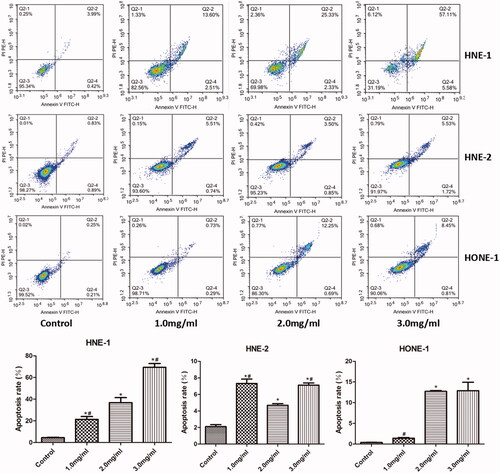
Figure 4. The migration of HNE-1, HNE-2 and HONE1 cells in various groups which was evaluated by scratch wound assay. Cells were cultured in the medium containing 1.0, 2.0 and 3.0 mg/ml of Junduqing extractive for 24 h. *p < .05 vs. Control; #p < .05 vs. 2.0 mg/ml.
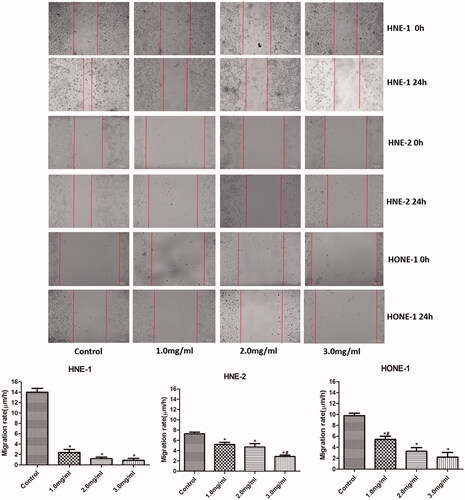
Figure 5. The invasion of HNE-1, HNE-2 and HONE1 cells in various groups which was evaluated by Transwell assay. Cells were cultured in the medium containing 1.0, 2.0 and 3.0 mg/ml of Junduqing extractive for 24 h. *p < .05 vs. Control.
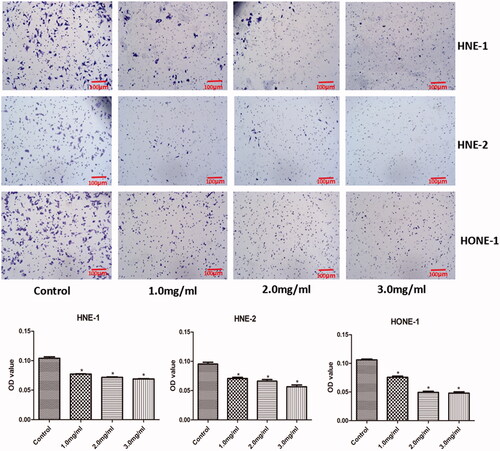
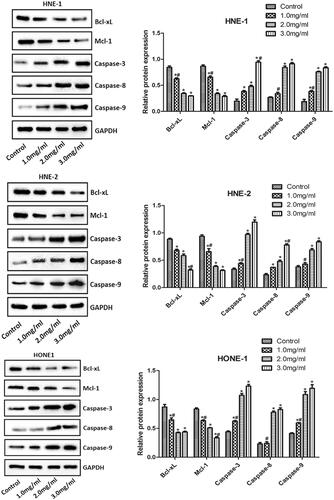
Figure 6. The levels of Bcl-xL, Mcl-1, Caspase-3, Caspase-8 and Caspase-9 in HNE-1, HNE-2 and HONE1 cells of various groups which were examined by western blotting. Cells were cultured in the medium containing 1.0, 2.0 and 3.0 mg/ml of Junduqing extractive for 24 h. *p < .05 vs. Control; #p < .05 vs. 2.0 mg/ml.
Data availability
The analysed data sets generated during this study are available from the corresponding author on reasonable request.