Figures & data
Figure 1. Analysis of the metabolite fingerprint in the serum by LC-MS-based metabolomics. Score plots of principal component analysis (PCA) in positive ion mode (A) and negative ion mode (B). Score plots of partial least-squares-discriminant analysis (PLS-DA) (C) and PLS-DA validate model (D). Score plots of orthogonal partial least square-discriminant analysis (OPLS-DA) in positive ion mode (E) and negative ion mode (F). (G) Potential metabolites in patients with VSD. S and RZ: VSD + HF group; Z and QZ: healthy individual group.
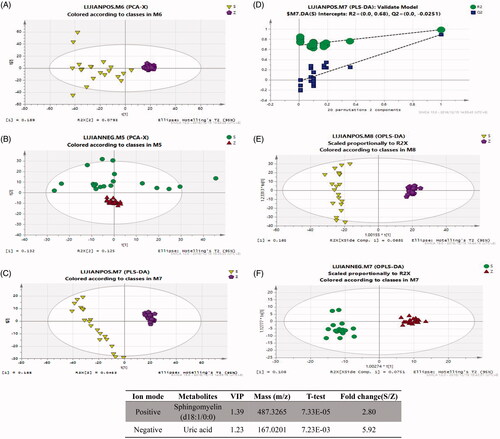
Figure 2. Elevation of UA and SM promoted autophagy in cardiomyocytes of patients with VSD. (A and B) p62 protein expression was decreased in VSD heart tissues, as detected by immunohistochemistry and Western blots assay, respectively. (C) The autophagic level was increased in VSD heart tissues, as assessed by TEM (scale bar: 200 nM). (D) The autophagic level was increased in cardiomyocytes treated with UA and SM, as assessed by TEM (scale bar: 200 nM). (E) p62 level was decreased while beclin-1 and Atg7 were increased in cardiomyocytes treated with UA and SM. (F) The number of GFP-LC3 positive cells was increased in cardiomyocytes treated with UA and SM, as assessed by GFP-LC3 adenovirus-transfected autophagic vesicle assay (scale bar:50 μM). (G) GFP signal was increased in cardiomyocytes treated with UA and SM assessed by GFP and RFP tandemly tagged LC3 (tfLC3) assays (scale bar: 50 μM). (H) mRNA expressions of EGFR and AKT3 were decreased in cardiomyocytes treated with UA and SM by RT-PCR. Values are mean ± SEM. For each experiment, three samples at least were available for the analysis. *p<.05, **p<.01, ***p<.001.
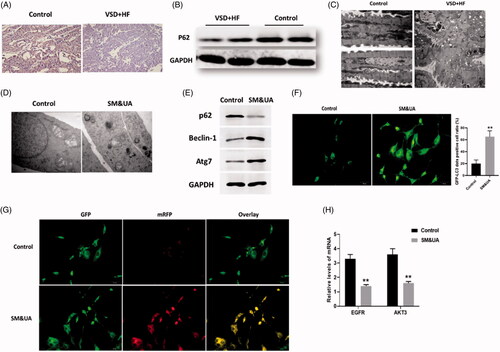
Figure 3. Upregulation of EGFR and AKT3 suppressed autophagy in cardiomyocytes treated with UA and SM. (A and F) EGFR and AKT3 protein expressions were increased in UA and SM-treated cardiomyocytes administrated with pLV-CMV-EGFR/AKT3 plasmids, respectively. (B and G) p62 level was increased while beclin-1 and Atg7 were decreased in UA and SM-treated cardiomyocytes administrated with pLV-CMV- EGFR/AKT3 plasmids, respectively. (C and H) Autophagic levels were decreased in UA and SM-treated cardiomyocytes administrated with pLV-CMV- EGFR/AKT3 plasmids, respectively, as assessed by TEM (scale bar: 200 nM). (D and I) The number of GFP-LC3 positive cells was decreased in UA and SM-treated cardiomyocytes administrated with pLV-CMV- EGFR/AKT3 plasmids, respectively, as assessed by GFP-LC3 adenovirus-transfected autophagic vesicle assay (scale bar: 50 μM). (E and J) GFP signals was decreased in UA and SM-treated cardiomyocytes administrated with pLV-CMV- EGFR/AKT3 plasmids, respectively, assessed by GFP and RFP tandemly tagged LC3 (tfLC3) assays (scale bar: 50 μM). Values are mean ± SEM. For each experiment, three samples at least were available for the analysis. *p < 0.05, **p < 0.01, ***p < 0.001.
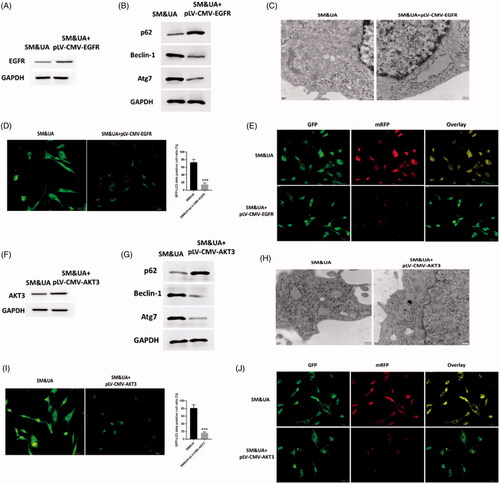
Figure 4. LncRNA MEG3 regulated UA and SM-induced autophagy in cardiomyocytes. (A) MEG3 was downregulated in UA and SM-treated cardiomyocytes. (B and G) Efficiencies of siMEG3 and pLV-CMV-MEG3 plasmid were evaluated by RT-PCR, respectively. (C and H) p62 protein level was decreased and increased in UA and SM-treated cardiomyocytes administrated with siMEG3 and pLV-CMV-MEG3 plasmid, respectively. Beclin-1 and Atg7 protein levels were increased and decreased in UA and SM-treated cardiomyocytes administrated with siMEG3 and pLV-CMV-MEG3 plasmid, respectively. (D and I) autophagic levels were increased and decreased in UA and SM-treated cardiomyocytes administrated with siMEG3 and pLV-CMV-MEG3 plasmid, respectively, as assessed by TEM (scale bar: 200 nM). (E and J) The number of GFP-LC3 positive cells was increased and decreased in UA and SM-treated cardiomyocytes administrated with siMEG3 and pLV-CMV-MEG3 plasmid, respectively, as assessed by GFP-LC3 adenovirus-transfected autophagic vesicle assay (scale bar: 50 μM). (E and J) GFP signals were increased and decreased in UA and SM-treated cardiomyocytes administrated with siMEG3 and pLV-CMV-MEG3 plasmid, respectively, assessed by GFP and RFP tandemly tagged LC3 (tfLC3) assays (scale bar: 50 μM). Values are mean ± SEM. For each experiment, three samples at least were available for the analysis. *p < .05, **p < .01, ***p < .001.
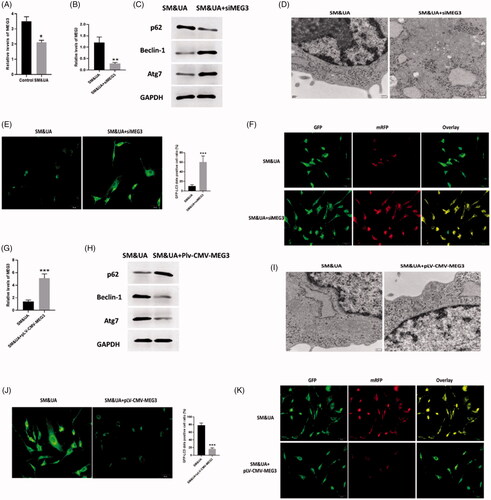
Figure 5. MEG3 and EGFR were target genes of miR-7-5p. (A) Expressions of EGFR and AKT3 in cardiomyocytes treated with SM&UA, SM&UA + siMEG3, and SM&UA + pLV-CMV-MEG3, respectively. (B) Expression of miR-7-5p in cardiomyocytes treated with SM&UA, SM&UA + siMEG3 and SM&UA + pLV-CMV-MEG3, respectively. (C and D) Predictive sequences of miR-7-5p binding sites in the 3′UTR of MEG3 and relative luciferase activity. (E) Expressions of EGFR and AKT3 in cardiomyocytes treated with SM&UA, SM&UA + miR-7-5p mimic and SM&UA + miR-7-5p inhibitor, respectively. (F and G) Predictive sequences of miR-7-5p binding sites in the 3’UTR of EGFR and relative luciferase activity. Values are mean ± SEM. For each experiment, three samples at least were available for the analysis. *p < .05, **p < .01, ***p < .001.
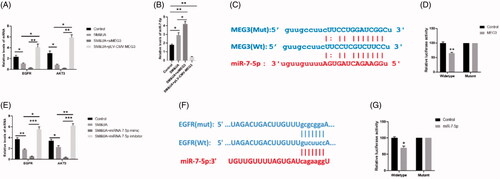
Figure 6. MiR-7-5p regulated UA and SM-induced autophagy in cardiomyocytes. (A and E) p62 protein level was decreased and increased in UA and SM-treated cardiomyocytes administrated with miR-7-5p mimic and inhibitor, respectively. Beclin-1 and Atg7 protein levels were increased and decreased in UA and SM-treated cardiomyocytes administrated with miR-7-5p mimic and inhibitor, respectively. (B and F) Autophagic levels were increased and decreased in UA and SM-treated cardiomyocytes administrated with miR-7-5p mimic and inhibitor, respectively, as assessed by TEM (scale bar: 200 nM). (E and J) The number of GFP-LC3 positive cells was increased and decreased in UA and SM-treated cardiomyocytes administrated with miR-7-5p mimic and inhibitor, respectively, as assessed by GFP-LC3 adenovirus-transfected autophagic vesicle assay (scale bar: 50 μM). (E and J) GFP signals were increased and decreased in UA and SM-treated cardiomyocytes administrated with miR-7-5p mimic and inhibitor, respectively, assessed by GFP and RFP tandemly tagged LC3 (tfLC3) assays (scale bar: 50 μM). Values are mean ± SEM. For each experiment, three samples at least were available for the analysis. *p < .05, **p < .01, ***p < .001.
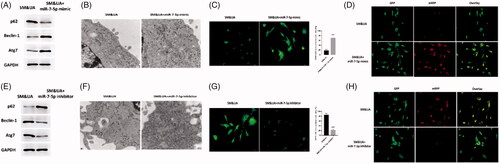
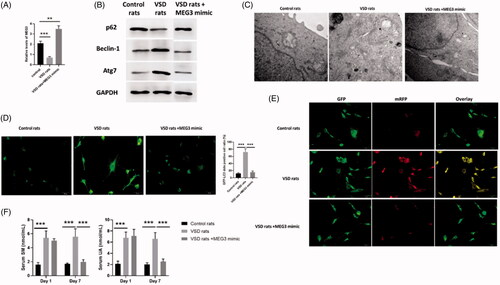
Figure 7. LncRNA MEG3 regulated UA and SM-induced autophagy in cardiomyocytes in vivo study. (A) MEG3 was decreased and increased in VSD rats and VSD rats treated with MEG3 mimic, respectively. (B) p62 protein level was decreased and increased in VSD rats and VSD rats treated with MEG3 mimic, respectively. Beclin-1 and Atg7 protein levels were increased and decreased in VSD rats and VSD rats treated with MEG3 mimic, respectively. (C) Autophagic levels were increased and decreased in VSD rats and VSD rats treated with MEG3 mimic, respectively, as assessed by TEM (scale bar: 200 nM). (D) The number of GFP-LC3 positive cells was increased and decreased in VSD rats and VSD rats treated with MEG3 mimic, respectively, as assessed by GFP-LC3 adenovirus-transfected autophagic vesicle assay (scale bar: 50 μM). (E) GFP signals were increased and decreased in VSD rats and VSD rats treated with MEG3 mimic, respectively, assessed by GFP and RFP tandemly tagged LC3 (tfLC3) assays (scale bar: 50 μM). (F) Serum UA and SM were determined by ELISA assay in VSD rats and VSD rats treated with MEG3 mimic. Values are mean ± SEM. For each experiment, three samples at least were available for the analysis. *p < .05, **p < .01, ***p < .001.