
Figures & data
Figure 1. Characterization of Exos: (A) Morphology of Exos observed by TEM. The scale bar is 100 nm. (B) Particle size and distribution analysis of Exos. (C) Western blotting of Exos surface markers.
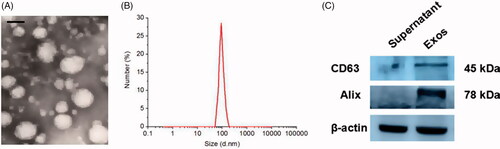
Figure 2. When low Exos concentrations (50 μg/mL) (Exos low) and high Exos concentrations (500 μg/mL) (Exos high) and the combination of high Exos (500 μg/mL) and LPS (100 ng/mL) concentrations (Exos high + LPS) were used to treat HG-HUVECs, Exos induced pro-angiogenic effects. untreated HG-HUVECs was used as the control group. (A) Exospromoted HG-HUVEC migration, as analyzed by scratch wound assay; this effect was reduced by Exos + LPS. (B) The migrating images of HG-HUVECs receiving different treatments were further confirmed by the transwell assay. Representative images of HG-HUVEC tube formation in different treatment groups. (C) Quantitative analysis of the scratch wound assay, transwell assay, and the tube-formation assay. The data are represented as the means ± SD (n = 3), #p<.05, compared untreated HG-HUVECs (control) with high Exos levels (500 μg/mL).*p < .05. (D) Cell viability was analyzed by CCK-8 assay with different treatments. The data are represented as the means ± SD (n = 3), *p < .05.
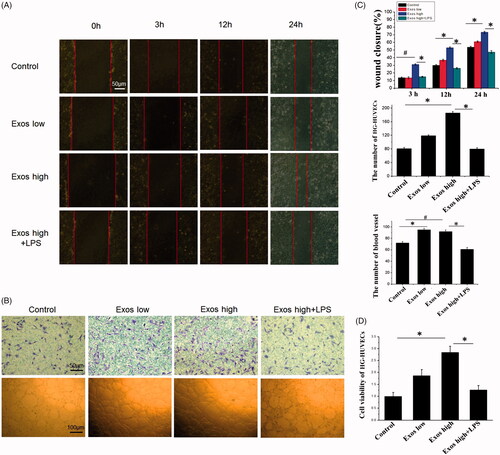
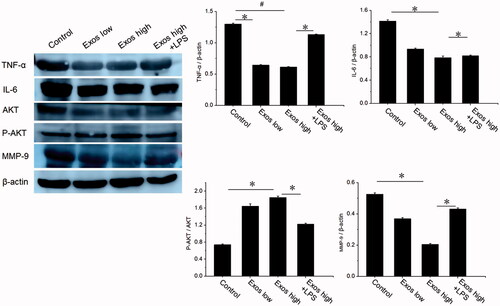
Figure 3. Detection of TNF-α, IL-6, AKT, P-AKT, and VEGF levels by Western blotting. The data are represented as the means ± SD (n = 3), #p<.05, compared untreated HG-HUVECs (control) with high Exos levels (500 μg/mL).*p < .05.
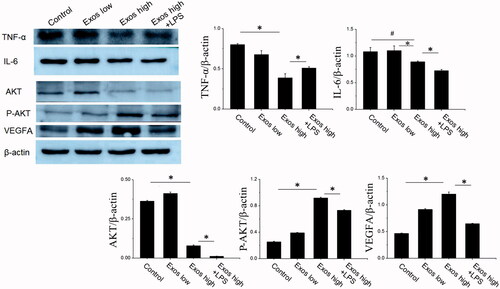
Figure 4. (A) Representative images of full-thickness skin defects in a diabetic rat model untreated (PBS) or treated with low Exos (100 μg/mL), high Exos (1 mg/mL), or high Exos (1 mg/mL) + LPS (10 μg/mL) at 0 days, 7 days, 14 days, and 21 days after operation. The scale bar in all is 5 mm. (B) Transmitted light images of H&E-stained sections of the untreated defects (PBS) and defects treated with low Exos, high Exos, or high Exos + LPS at day 7 after operation. (C) The wound size reduction in wounds receiving different treatments based on representative images of full-thickness skin defects in a diabetic rat model. The data are represented as the means ± SD (n = 3), #p<.05, compared PBS group with high Exos levels (1 mg/mL), *p < .05. (D) Determination of wound contraction rate based on transmitted light images of H&E-stained sections. The data are represented as the means ± SD (n = 3), *p < .05.
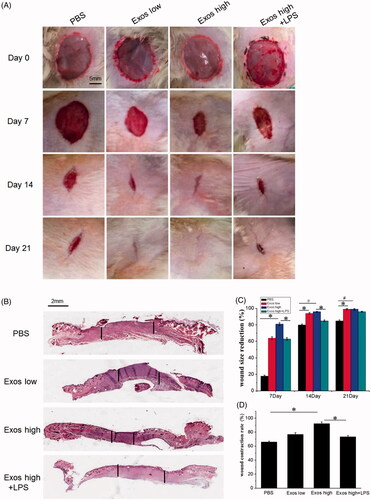
Figure 5. H&E staining of tissue sections treated with PBS, low Exos concentrations (100 μg/mL), high Exos concentrations (1 mg/mL), or high Exos (1 mg/mL) + LPS (10 μg/mL) concentrations on days 7 and 14. The scale bar in figure is 50 μm.
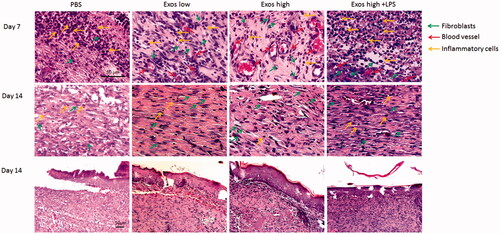
Figure 6. Masson’s trichrome staining of wound sections treated with PBS, low Exos concentrations (100 μg/mL), high Exos concentrations (1 mg/mL), or high Exos (1 mg/mL) + LPS (10 μg/mL) concentrations at days 7 and 14. The data are presented as the means ± SD (n = 3); *p < .05. The scale bar in all figure is 200 μm. The relative pigmentation area (%) was determined by calculating the ratio of area of the blue stain (collagen fibers) to the whole selected area.
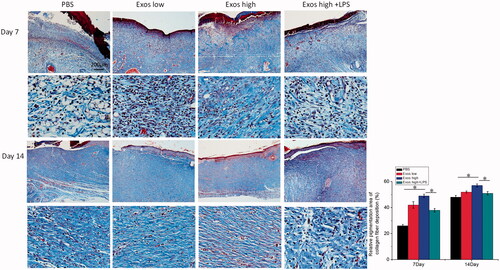
Figure 7. (A) Immunofluorescence staining of CD31. Newly formed blood vessels were identified by positive CD31 staining at postoperative day 7. The scale bar in figure 7 A is 50 μm. (B) Quantitative analysis of the number of blood vessels. The data are represented as the means ± SD (n = 3), *p < .05.
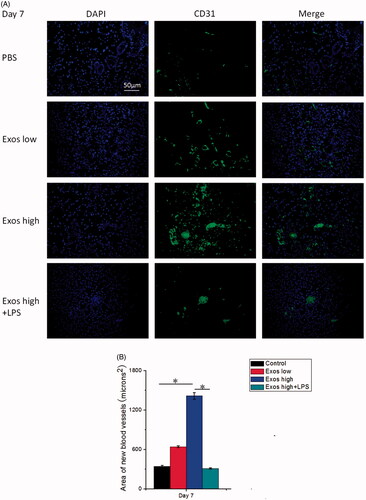
Figure 8. Immunohistochemistry analysis of IL-6 expression and TNF-α expression in diabetic wound sites treated with PBS, low concentrations of Exos, high concentrations of Exos, and high Exos + LPS concentrations at days 7 and 14; quantitative analysis of IL-6 expression and TNF-α expression. The data are presented as the means ± SD (n = 3); *p < .05.
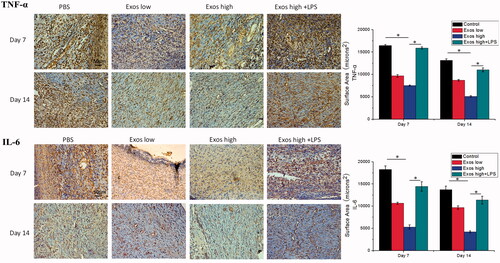
Figure 9. Detection of the levels of AKT, P-AKT, TNF-α, IL-6 and MMP-9 by Western blotting; the data are presented as the means ± SD (n = 3); #p<.05, compared PBS group with high Exos levels (1 mg/mL), *p < .05.