1,584
Views
20
CrossRef citations to date
0
Altmetric
Research Article

Upregulation of lncRNA H19 promotes nasopharyngeal carcinoma proliferation and metastasis in let-7 dependent manner

, , , , &
Pages 3854-3861 | Received 19 Jun 2019, Accepted 02 Sep 2019, Published online: 26 Sep 2019

Figures & data

Figure 1. lncRNA H19 is unregulated in nasopharyngeal carcinoma and indicates a poor survival outcome. (A) The H19 levels in normal adjacent tissues or tumours were determined by qPCR. (B) The H19 levels in patients with or without metastasis were determined by qPCR. (C) Overall survival analysis revealed that nasopharyngeal carcinoma patients with high H19 levels displayed poor survival outcomes. **p < .01, ***p < .001. Student’s t-test in (A) and (B), log-rank test in (C).

Figure 1. lncRNA H19 is unregulated in nasopharyngeal carcinoma and indicates a poor survival outcome. (A) The H19 levels in normal adjacent tissues or tumours were determined by qPCR. (B) The H19 levels in patients with or without metastasis were determined by qPCR. (C) Overall survival analysis revealed that nasopharyngeal carcinoma patients with high H19 levels displayed poor survival outcomes. **p < .01, ***p < .001. Student’s t-test in (A) and (B), log-rank test in (C).

Figure 2. LncRNA H19 promotes nasopharyngeal carcinoma cells proliferation. (A) The mRNA expression of H19 in CNE1 cells transfected with H19 shRNA was determined by qPCR. (B) Cell viability of CNE1 cells transfected with H19 shRNA or vector was determined by MTT assay. (C) Cell viability of CNE2 cells transfected with H19 shRNA or vector was determined by MTT assay. (D) Cell viability of CNE1 cells transfected with H19 shRNA or vector was determined by cell counts assay. (E) Cell viability of CNE2 cells transfected with H19 shRNA or vector was determined by cell counts assay. (F) The mRNA expression of H19 in CNE1 cells transfected with H19 expression plasmid was determined by qPCR. (G) Cell viability of CNE1 cells transfected with H19 expression plasmid or vector was determined by cell counts assay. (H) Cell viability of CNE2 cells transfected with H19 expression plasmid or vector was determined by cell counts assay. Data are mean + SD. *p < .05, **p < .01 and ***p < .001.
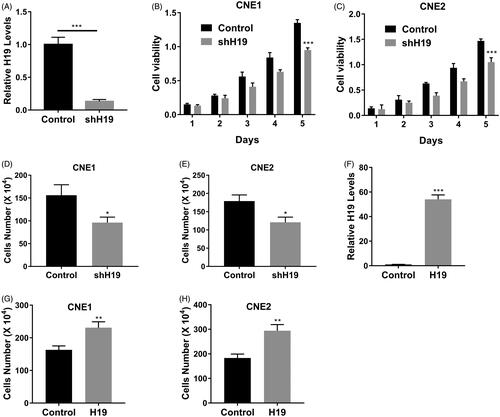
Figure 2. LncRNA H19 promotes nasopharyngeal carcinoma cells proliferation. (A) The mRNA expression of H19 in CNE1 cells transfected with H19 shRNA was determined by qPCR. (B) Cell viability of CNE1 cells transfected with H19 shRNA or vector was determined by MTT assay. (C) Cell viability of CNE2 cells transfected with H19 shRNA or vector was determined by MTT assay. (D) Cell viability of CNE1 cells transfected with H19 shRNA or vector was determined by cell counts assay. (E) Cell viability of CNE2 cells transfected with H19 shRNA or vector was determined by cell counts assay. (F) The mRNA expression of H19 in CNE1 cells transfected with H19 expression plasmid was determined by qPCR. (G) Cell viability of CNE1 cells transfected with H19 expression plasmid or vector was determined by cell counts assay. (H) Cell viability of CNE2 cells transfected with H19 expression plasmid or vector was determined by cell counts assay. Data are mean + SD. *p < .05, **p < .01 and ***p < .001.

Figure 3. LncRNA H19 promotes migration and invasion in nasopharyngeal carcinoma cells. (A) The H19 levels in parental or lung-metastatic CNE1 cells were determined by qPCR. (B) Transwell migration and invasion assay of CNE1 cells transfected with H19 shRNA. (C) The statistical results of transwell migration and invasion assay in CNE1 cells. (D) Transwell migration and invasion assay of CNE2 cells transfected with H19 shRNA. (E) The statistical results of transwell migration and invasion assay in CNE2 cells. (F) Scattering colony formation assay of CNE1 cells transfected with shH19 or vector. (G) Scattering colony formation assay of CNE2 cells transfected with shH19 or vector. Data are mean + SD. **p < .01 and ***p < .001.
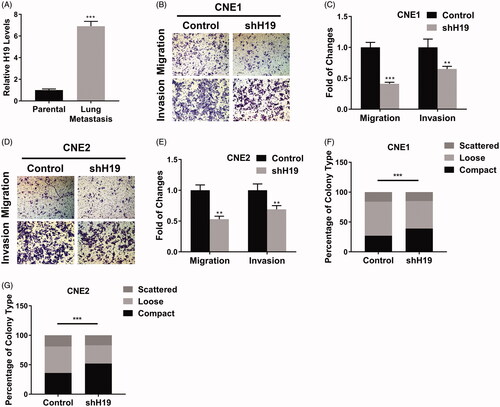
Figure 3. LncRNA H19 promotes migration and invasion in nasopharyngeal carcinoma cells. (A) The H19 levels in parental or lung-metastatic CNE1 cells were determined by qPCR. (B) Transwell migration and invasion assay of CNE1 cells transfected with H19 shRNA. (C) The statistical results of transwell migration and invasion assay in CNE1 cells. (D) Transwell migration and invasion assay of CNE2 cells transfected with H19 shRNA. (E) The statistical results of transwell migration and invasion assay in CNE2 cells. (F) Scattering colony formation assay of CNE1 cells transfected with shH19 or vector. (G) Scattering colony formation assay of CNE2 cells transfected with shH19 or vector. Data are mean + SD. **p < .01 and ***p < .001.

Figure 4. LncRNA H19 promotes nasopharyngeal carcinoma proliferation and metastasis in vivo. (A) Tumour growth curve of CNE1 cells transfected with shH19 or vector. (B) The weight of tumours derived from CNE1 cells transfected with shH19 or vector. (C) Ki-67 staining of the tumours derived from CNE1 cells transfected with shH19 or vector. (D) The statistical of the lung metastasis in the tail veil injection mouse with CNE1 cells transfected with shH19 or vector. (E) The body weight of the tail vein injection mouse. Data are mean + SD. **p < .01 and ***p < .001.
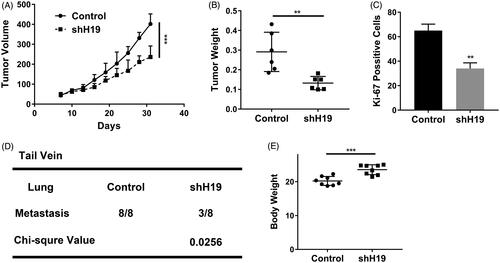
Figure 4. LncRNA H19 promotes nasopharyngeal carcinoma proliferation and metastasis in vivo. (A) Tumour growth curve of CNE1 cells transfected with shH19 or vector. (B) The weight of tumours derived from CNE1 cells transfected with shH19 or vector. (C) Ki-67 staining of the tumours derived from CNE1 cells transfected with shH19 or vector. (D) The statistical of the lung metastasis in the tail veil injection mouse with CNE1 cells transfected with shH19 or vector. (E) The body weight of the tail vein injection mouse. Data are mean + SD. **p < .01 and ***p < .001.

Figure 5. LncRNA H19 binds to let-7 family and regulates HRAS expression. (A) Schematic diagram of let-7 family binding sites on H19. (B) Luciferase reporter assay of pSi-check2 plasmid contains H19 and transfected with let-7 family. (C) The mRNA levels of let-7 family were determined in CNE1 cells transfected with shH19. (D) The HRAS levels in CNE1 cells transfected with shH19 were determined by qPCR. (E) The HRAS levels in CNE1 cells transfected with shH19 were determined by western blot. Data are mean + SD. **p < .01 and ***p < .001.
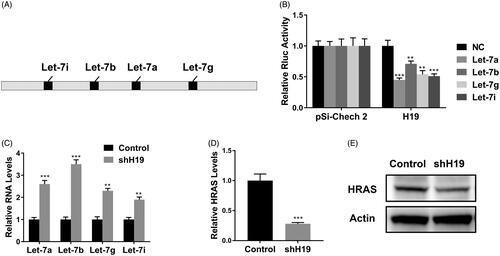
Figure 5. LncRNA H19 binds to let-7 family and regulates HRAS expression. (A) Schematic diagram of let-7 family binding sites on H19. (B) Luciferase reporter assay of pSi-check2 plasmid contains H19 and transfected with let-7 family. (C) The mRNA levels of let-7 family were determined in CNE1 cells transfected with shH19. (D) The HRAS levels in CNE1 cells transfected with shH19 were determined by qPCR. (E) The HRAS levels in CNE1 cells transfected with shH19 were determined by western blot. Data are mean + SD. **p < .01 and ***p < .001.