Figures & data
Figure 1. Identification of human adipose tissue-derived mesenchymal stem cells (AMSCs) and exosomes. (A) Western blot analysis of the surface markers in AMSCs. (B) Representative images of Human AMSCs. (D) Oil Red O straining in cumulus cells (CCs) treated with adipogenesis kit (original magnification × 100, Scale bar = 50 μm). (D) Western blot analysis of CD9, CD63 and CD81 expression in AMSC exosomes. “Exo-control” denotes precipitates from AMSCs, and DMEM were used as a negative control. “Exo-323-3p” denotes exosomes derived from modified AMSCs.
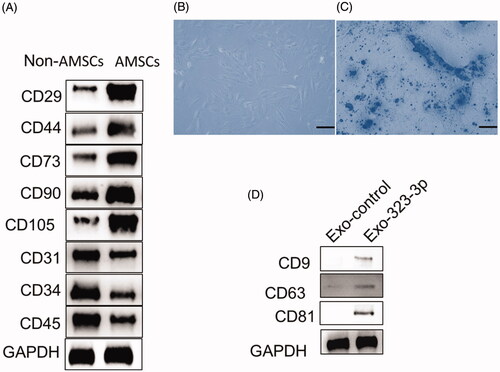
Figure 2. Upregulation of miR-323-3p promoted cell growth and inhibited apoptosis in cumulus cells (CCs). Detection of miR-323-3p expression in (A) human adipose tissue-derived mesenchymal stem cells (AMSCs), (B) AMSC exosome and (C) CCs. (D) Cell proliferation. (E) Cell cycle distribution. (F) Bax Bcl-2, and caspase-3 protein expression in CCs transfected miR-323-3p-modified exosomes. (G) Apoptosis level in CCs transfected miR-323-3p-modified exosomes. (*) Denotes differences from the control group (p < .05). Values are means ± SEM. For each experiment, at least 4 samples were available for the analysis.
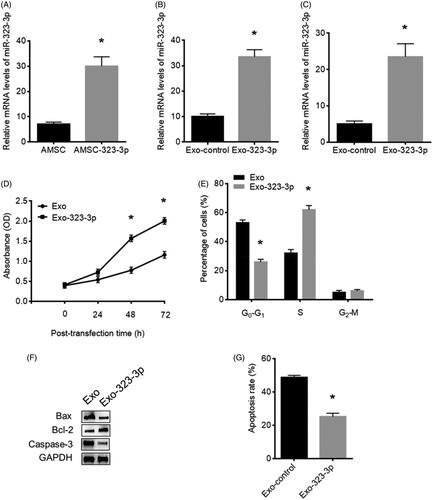
Figure 3. MiR-323-3p inhibitor reversed effect of miR-323-3p on cumulus cells (CCs). (A) miR-323-3p expression in CCs transfected with miR-323-3p inhibitor. (B) Cell proliferation, (C) cell cycle distribution and (D) apoptosis level in CCs transfected with the miR-323-3p inhibitor. (*) Denotes differences from the control group (p < .05). Values are means ± SEM. For each experiment, at least 4 samples were available for the analysis.
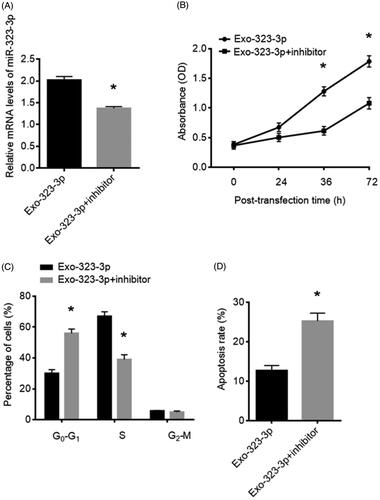
Figure 4. MiR-323-3p directly targets PDCD4 in CCs. (A) PDCD4 protein expression in PCOS CCs. (B) PDCD4 protein expression in CCs transfected with exosomes loaded with miR-323-3p. (C) PDCD4 protein expression in CCs transfected with miR-323-3p-motified exosomes and miR-323-3p inhibitor. (D) Sequence information about the wildtype and mutant miR-323-3p binding sites in the 3’UTR of PDCD4. (E) Relative luciferase activity. (*) Denotes differences from the control group (p < .05). Values are means ± SEM. For each experiment, at least 4 samples were available for the analysis.
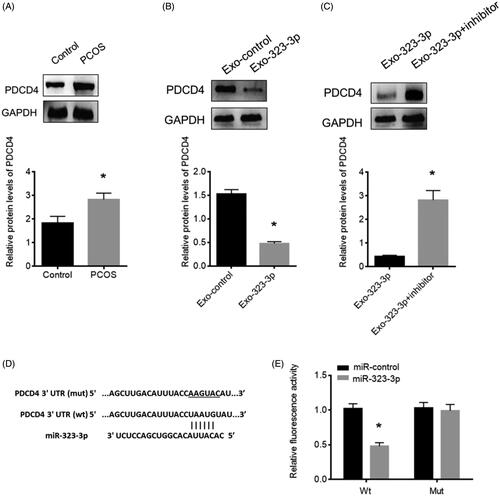
Figure 5. MiR-323-3p promoted cell growth and inhibited apoptosis in cumulus cells (CCs) by targeting PDCD4. CCs were transfected with miR-323-3p and miR-323-3p + PDCD4-pcDNA. (A) Cell proliferation. (B) Cell cycle distribution. (D) Apoptosis level. (*) Denotes differences from the control group (p < .05). Values are means ± SEM. For each experiment, at least 4 samples were available for the analysis.
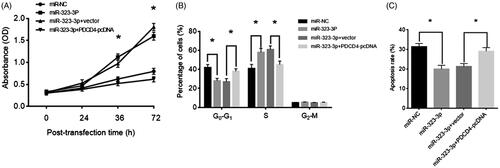
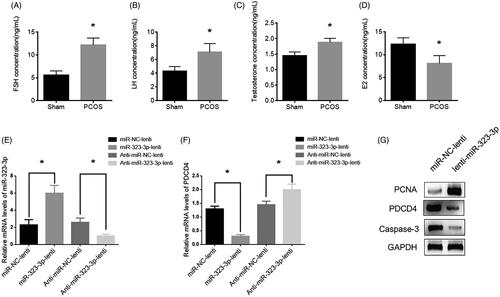
Figure 6. MiR-323-3p promoted cell growth and inhibited apoptosis in vivo. The serum levels of (A) FSH, (B) LH, (C) testosterone and (D) E2. (E) MiR-323-3p expression. (F) PDCD4 protein expression. (G) Protein expressions of PCNA, PDCD4 and caspase-3. (*) Denotes differences from the control group (p < .05). Values are means ± SEM. For each experiment, at least 4 samples were available for the analysis.