
Figures & data
Table 1. Demographic information.
Table 2. Association between TP73-AS1 gene polymorphisms and risk of gastric cancer (rs1181865, rs3737589).
Table 3a. Stratified analyses for TP73-AS1 genotypes in cases and controls (rs1181865).
Table 3b. Stratified analyses for TP73-AS1 genotypes in cases and controls (rs3737589).
Table 4. Associations between variant TP73-AS1 genotypes and clinicopathologic characteristics of gastric cancer (rs3737589).
Figure 1. the RNAfold algorithm in silico predicting the impact of rs1181865 (A) and rs3737589 (B) on the local secondary structure of TP73-AS1.
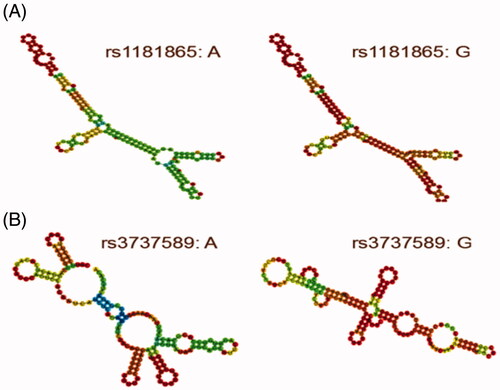
Figure 2. The effect of rs3737589 on TP73-AS1 expression level. (A): The genotype of rs3737589 and expression of TP73-AS1 gene in stomach was based on the public GTEx portal database. (B): TP73-AS1 levels were determined by qRT-PCR in GC tissues in subjects with the AA (n = 40), AG (n = 35) or GG (n = 5) genotype of rs3737589. Results were shown as mean ± standard error relative to GAPDH levels.
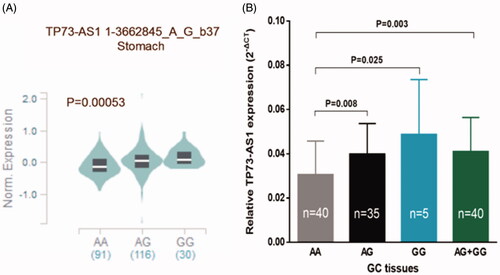
Figure 3. Kaplan-Meier survival curves for the overall survival by characteristics and clinical features of gastric cancer patients. (age, sex, sites, depth of invasion, lymph nodes metastasis.).
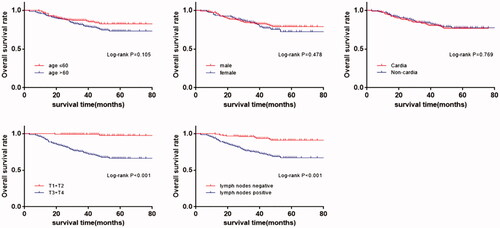
Figure 4. Kaplan-Meier survival curves of rs3737589 polymorphism for the overall survival in patients with gastric cancer. (AA vs. AG, AA vs. GG, AA vs. AG + GG.).
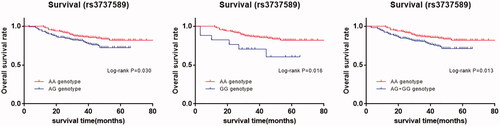
Table 5. Survival analysis by clinicopathologic features of gastric cancer patients.
Table 6. Association between genotype of rs3737589 and overall survival in gastric cancer patients.