Figures & data
Table 1. siRNAs sequences corresponding to circ_19698.
Table 2. The primers used in qRT-PCR assays.
Figure 1. GO enrichment analysis of 1484 known LR-associated mRNAs. (A) The top nine over-represented biological processes are displayed, which indicate that 1484 mRNAs were primarily involved in these biological processes, and the terms including cell proliferation regulation and cell cycle regulation ranked among the top nine. The Y-axis represents the top ranked GO biological terms, and different colors denote different GO biological terms; the X-axis represents related mRNA numbers. (B) Several cell proliferation-related biological processes were enriched and selected. The Y-axis represents the GO biological terms related to cell proliferation, and different colors denote different GO biological terms; the X-axis represents related mRNA numbers.
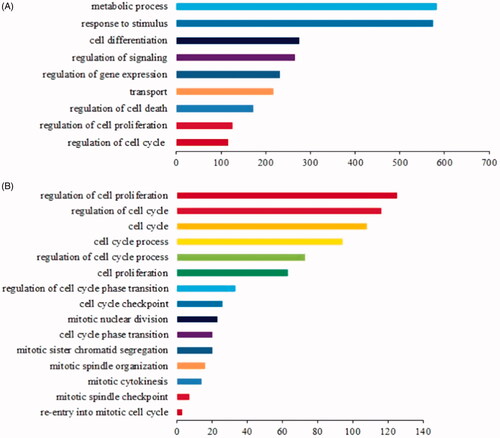
Figure 2. Cluster analysis of the expression profiles of cell proliferation-related mRNAs during rat liver regeneration. (A) K-means clustering of total significantly changed 169 cell proliferation-related genes. Red and green denote the expression levels higher and lower than the control, respectively. (B) The line graph showing the different expression patterns of four clusters (C1–C4). X-axis represents 10 time points following rat partial hepatectomy, and the Y-axis represents the mean expression level of each cluster.
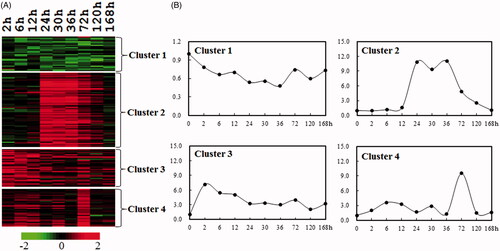
Figure 3. The numbers of circRNAs, miRNAs, and mRNAs obtained by circRNA–miRNA pair and miRNA–mRNA pair prediction. Outer circle denotes the numbers of circRNAs, miRNAs and mRNAs, which are related only to cell proliferation in rat; Inner circle indicates the numbers of circRNAs, miRNAs and mRNAs which are related to both cell proliferation and rat liver regeneration.
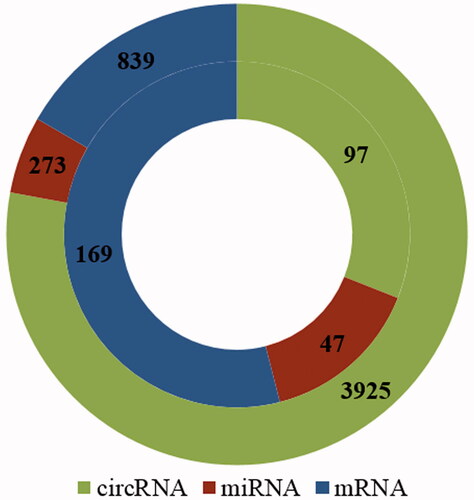
Figure 4. The circRNA–miRNA–mRNA interactive network regulating the process of cell proliferation and cell cycle during rat liver regeneration. Green circle nodes represent circRNAs, red triangle nodes represent miRNAs, and blue rectangle nodes represent mRNAs.
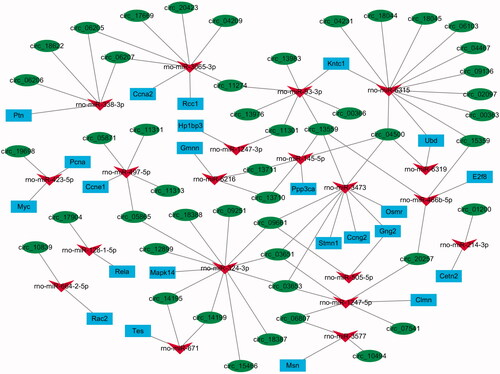
Table 3. Fourteen circRNA–miRNA–mRNA groups obtained from circRNA–miRNA negative correlation and miRNA–mRNA negative correlation analysis.
Figure 5. qRT-PCR results indicating the evaluation of siRNAs targeting circ_19698 and the effects of Si-circ_19698-1 on the expressions of Tnfrsf21 and miR-423-5p in BRL-3A cells following transfection for 48 h. (A) Si-circ_19698-1 was more efficient than Si-circ_19698-2 in inhibiting the expression of circ_19698 when compared with Si-scramble. (B) The more efficient Si-circ_19698-1 led to the down-regulation of Tnfrsf21 (the linear host gene for circ_19698). (C) The more efficient Si-circ_19698-1 led to the obvious up-regulation of a potential target rno-miR-423-5p. *p < .05, **p < .01 vs. the Si-scramble group.
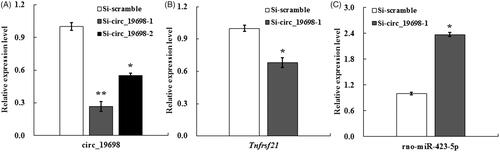
Figure 6. Effects of circ_19698 interference on the growth of BRL-3A liver cells. (A) MTT detection result showed the inhibitory effects of Si-circ_19698-1 on cell viability at indicated time points. (B) Histogram analysis of the flow cytometry results indicated that Si-circ_19698-1 led to cell cycle arrest at the G0/G1 phase compared with the Si-scramble group once BRL-3A cells were treated for 48 h. *p < .05, **p < .01 vs. the Si-scramble group.
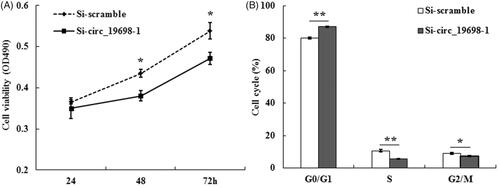
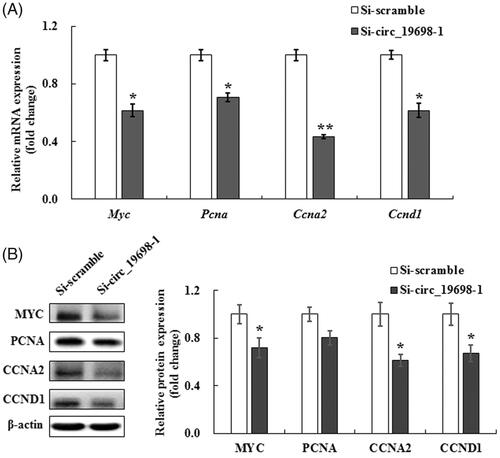
Figure 7. Effects of circ_19698 interference on the expression of cell proliferation-related genes and proteins in BRL-3A cells. The mRNA and protein were extracted from cultured BRL-3A rat liver cells. The results shown are representative of three individual experiments. (A) Expression of Myc, Pcna, Ccna2, and Ccnd1 mRNAs in BRL-3A cells. The results were normalized to β-actin and expressed as mean ± SD. (B) Expression of MYC, PCNA, CCNA2, and CCND1 proteins in BRL-3A cells. β-actin was used as the internal control. The intensities of these proteins were quantified, normalized to β-actin, and expressed as mean ± SD. *p < .05, **p < .01 vs. the Si-scramble group.