Figures & data
Figure 1. ZBTB20 expression in gastric cancer tissues. ZBTB20 expression levels in gastric cancer tissues (n = 37) and their adjacent normal gastric tissues (n = 37) were determined by real-time PCR (A) and immunohistochemistry (B). Scale bars: 100 μm. (C, D) ZBTB20 expression levels in gastric cancer patients with different status of H. pylori infection and metastasis were determined by real-time PCR. (E) Overall survival of gastric cancer patients from Kaplan Meier-plotter database. *p < .05, **p < .01, ***p < .001 compared with adjacent normal, infection, or metastasis group.
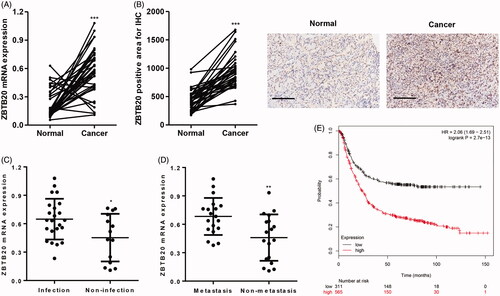
Figure 2. Effect of H. pylori infection on the expression of IκBα, p-NF-κBp65 and NF-κBp65 in gastric cancer cells. (A) ZBTB20 expression levels in gastric cancer cell lines and GES-1 human gastric epithelial mucosa cell line were determined by western blot. ZBTB20 expression levels (B, C), transcriptional activation of ZBTB20 (D, E), and the protein expression of IκBα, p-NF-κBp65 and NF-κBp65 (F, G) upon H. pylori infection in BGC-823 and MKN-45 gastric cancer cell lines were determined by real-time PCR, western blot or luciferase reporter gene assay. **p < .01, ***p < .001 compared with control group.
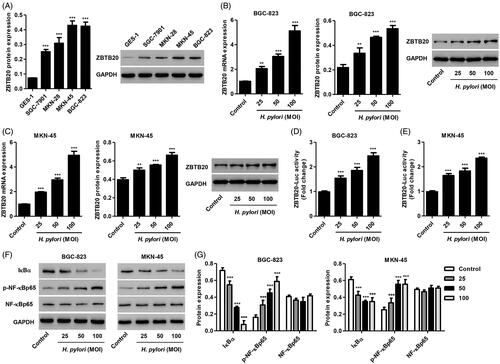
Figure 3. Effect of ZBTB20 silencing on the proliferation of gastric cancer cell lines. BGC-823 (A, B) and MKN-45 cells (C, D) were transfected with three siRNAs targeting human ZBTB20, and the expression levels of ZBTB20 were determined by real-time PCR and western blot analysis. (E, F) BGC-823 and MKN-45 cells were transfected with siRNA-1 and siRNA-2 targeting human ZBTB20, and cell proliferation was determined by CCK-8. ***p < .001 compared with siNC.
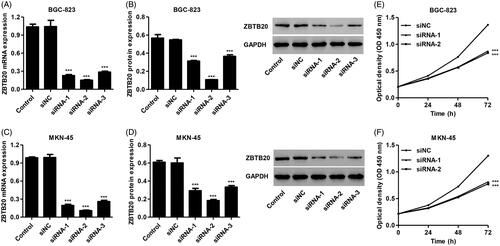
Figure 4. Effect of ZBTB20 silencing on migration and invasion of gastric cancer cell lines. BGC-823 and MKN-45 cells were transfected with siRNA-1 and siRNA-2 targeting human ZBTB20. Cell migration and invasion were determined by Transwell (A, B) and Wound healing assay (C, D); the protein expression of IκBα, p-NF-κBp65, NF-κBp65, MMP-2 and MMP-9 was determined by western blotting (E, G); and the activity of MMP-2 and MMP-9 was determined by Gelatin zymography gel assay (F, H). ***p < .001 compared with siNC.
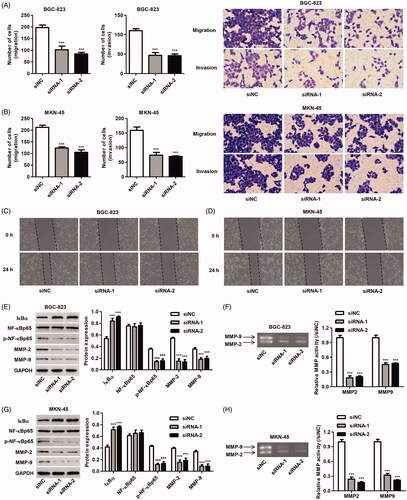
Figure 5. Effect of ZBTB20 overexpression on the proliferation of gastric cancer cell lines. BGC-823 and MKN-45 cells were infected with pCDNA3.1(+)-ZBTB20 or blank vector, the expression levels of ZBTB20 were determined by real-time PCR (A, C) and western blot analysis (B, D), and cell proliferation was determined by CCK-8 (E, F). ***p < .001 compared with blank vector.
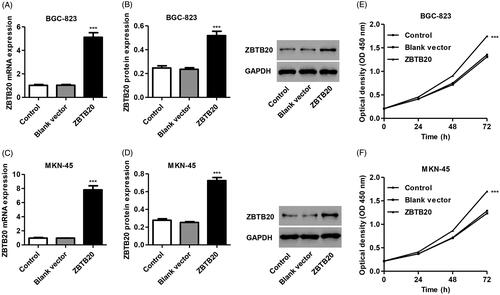
Figure 6. Effect of ZBTB20 overexpression on the migration and invasion of gastric cancer cell lines. BGC-823 and MKN-45 cells were infected with pCDNA3.1(+)-ZBTB20 or blank vector. Cell migration and invasion were determined by Transwell (A, B) and Wound healing assay (C, D); the protein expression of IκBα, p-NF-κBp65, NF-κBp65, MMP-2 and MMP-9 (E, G) was determined by western blotting; and the activity of MMP-2 and MMP-9 was determined by Gelatin zymography gel assay (F, H). **p < .01, ***p < .001 compared with blank vector.
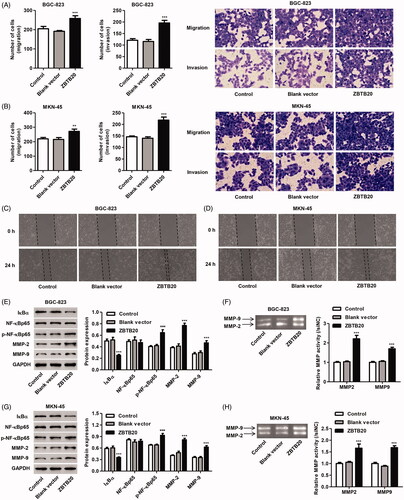
Figure 7. IκBα overexpression inhibits gastric cancer cell proliferation induced by ZBTB20. BGC-823 and MKN-45 cells were infected with pCDNA3.1(+)-IκBα or blank vector, and the expression levels of IκBα were determined by real-time PCR (A, C) and western blotting (B, D). BGC-823 and MKN-45 cells were infected with pCDNA3.1(+)-ZBTB20 and pCDNA3.1(+)-IκBα, and cell proliferation was determined by CCK-8 (E, F). ***p < .001 compared with control; ###p < .001 compared with pCDNA3.1(+)-ZBTB20.
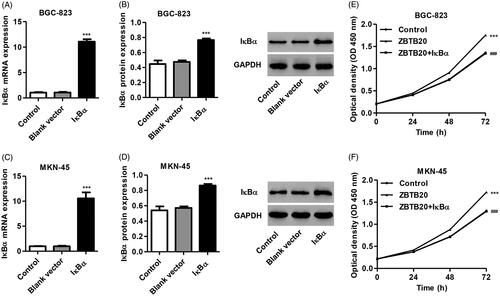
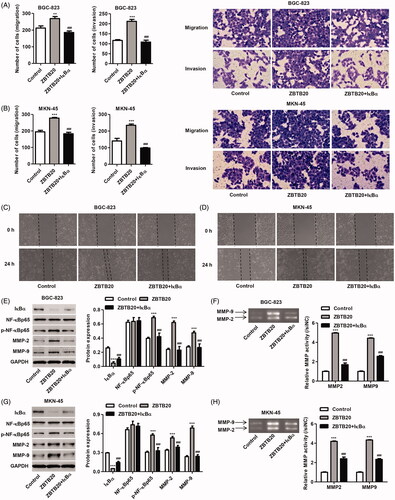
Figure 8. IκBα overexpression inhibits gastric cancer cell migration and invasion induced by ZBTB20. BGC-823 and MKN-45 cells were infected with pCDNA3.1(+)-ZBTB20 and pCDNA3.1(+)-IκBα. Cell migration and invasion were determined by Transwell (A, B) and Wound healing assay (C, D); the protein expression of IκBα, p-NF-κBp65, NF-κBp65, MMP-2 and MMP-9 (E, G) was determined by western blotting; and the activity of MMP-2 and MMP-9 was determined by Gelatin zymography gel assay (F, H). **p < .01, ***p < .001 compared with control; ###p < .001 compared with pCDNA3.1(+)-ZBTB20.