Figures & data
Figure 1. Propofol inhibits OSCC cell growth and promotes cell apoptosis. (A–D) UM-SCC6 and SCC090 cells were treated with propofol at the indicated concentrations, and cleaved PARP1 and Caspase 3 activity was detected. (E–H) UM-SCC6 and SCC090 cells were treated with 20 μg/ml propofol for the indicated times, and cleaved PARP1 and Caspase 3 activity was detected. (I–M) UM-SCC6 and SCC090 were treated with propofol as indicated. Cell proliferation was analyzed by colony formation and EdU assays. For (B), (D), (F), (H), (J), (K) and (M), the results are representative of three independent experiments, and the data are shown as the means ± s.d. Student’s t-test, *p < .05, **p < .01, ***p < .001.
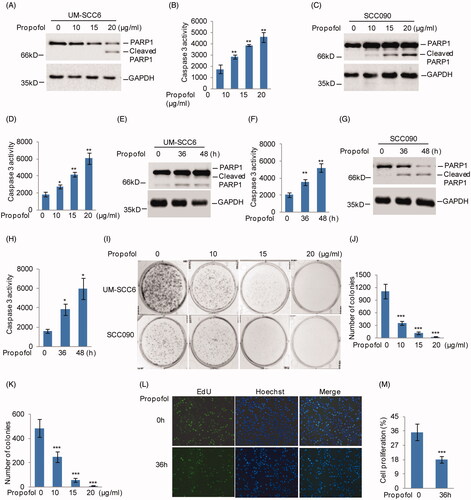
Figure 2. Propofol enhances GAS5 expression in OSCC cells. (A, B) UM-SCC6 cells were treated with 20 μg/ml propofol as the indicated times, and the altered lncRNAs were analyzed by RNA sequencing analysis. (C) The upregulated lncRNAs (fold change >2) are listed. (D–G) UM-SCC6 and SCC090 cells were treated with propofol as indicated. GAS5 expression levels were analyzed by q-RT-PCR. (H–M) GAS5 was knocked down in UM-SCC6 and SCC090 cells, and the cells were then treated with propofol as indicated. Cell proliferation was analyzed by colony formation assay, and cell apoptosis was analyzed by western blot. For (D–G), (I), and (K), the results are representative of three independent experiments, and the data are shown as the means ± s.d. Student’s t-test, *p < .05, **p < .01, ***p < .001.
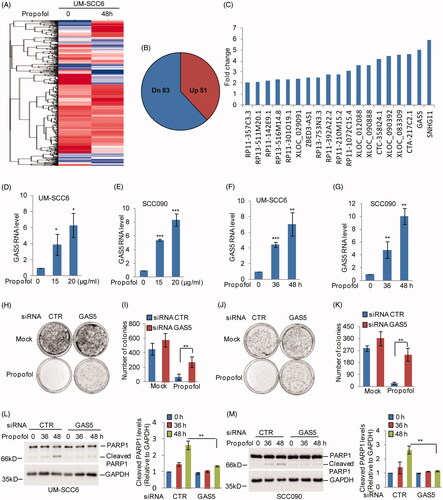
Figure 3. GAS5 acts as a ceRNA of miR-1297. (A) The RNA level of miR-1297 is listed. (B) The binding site between GAS5 and miR-1297 was predicated from starBase. (C) UM-SCC6 and SCC090 were treated with propofol as indicated. The RNA levels of miR-1297 were analyzed by q-RT-PCR. (D, E) UM-SCC6 and SCC090 cells with or without GAS5 knockdown were treated with propofol for the indicated times. The expression levels of miR-1297 were analyzed. (F, G) RNA-binding protein immunoprecipitation was performed using anti-Ago2 antibody in UM-SCC6 cells, and IgG was used as the negative control. Q-RT-PCR was performed to detect the pull-down of GAS5 and miR-1297. (H) Schematic diagrams of luciferase reporters containing the wild-type binding site of miR-1297 on GAS5, named psiCHECK2-GAS5 wild type (WT), and the mutant binding site, named psiCHECK2-GAS5 Mut. (I) psiCHECK2-GAS5 WT or psiCHECK2-GAS5 Mut was co-transfected with miR-1297 or the negative control into UM-SCC6 cells, and luciferase activity was measured. (J) psiCHECK2-GAS5 WT together with miR-1297 or the negative control was transfected into UM-SCC6 cells. The cells were then treated with propofol for the indicated times, and luciferase activity was measured. For B-F, H, and I, the results are representative of three independent experiments, and the data are shown as the means ± s.d. Student’s t-test, *p < .05, **p < .01, ***p < .001.
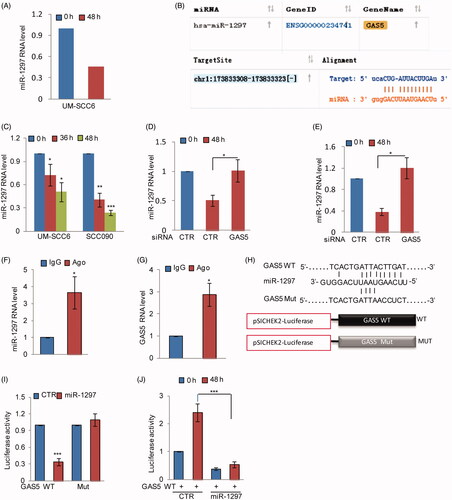
Figure 4. miR-1297 suppresses GSK3β in human OSCC cells. (A) UM-SCC6 cells were treated with propofol for the indicated times. The expression levels of p-Mcl1 and Mcl1 were analyzed by western blot. (B, C) UM-SCC6 cells with or without knockdown of GAS5 were treated with 20 μg/ml propofol for 36 h, and the cells were incubated with 10 μM CHX for the indicated periods. Cell lysates from the indicated time points were subjected to western blot analysis with anti-Mcl1 antibody. (D, E) UM-SCC6 and SCC090 cells were treated with 20 μg/ml propofol for the indicated times. The expression levels of GSK3α and GSK3β were analyzed by western blot. (F) Schematic diagrams of luciferase reporters containing the wild-type or mutational binding site of miR-1297 on GSK3β 3'UTR, named GSK3β-3 UTR wild type (WT) or Mut. (G–I) GSK3β-3 UTR WT or Mut together with miR-1297 were transfected into UM-SCC6 and SCC090 cells. Luciferase activity was measured by luciferase assay, and the protein levels of GSK3β were analyzed by western blot. (J–L) GSK3β-3 UTR WT or Mut together with the miR-1297 inhibitor were transfected into UM-SCC6 and SCC090 cells. Luciferase activity was measured by luciferase assay, and the protein levels of GSK3β were analyzed by western blot. (M) UM-SCC6 cells with or without GAS5 knockdown were treated with 20 μg/ml propofol for the indicated times, and cell lysates were analyzed using the indicated antibodies. (N) miR-1297 inhibitor or the negative control was transfected into UM-SCC6 cells with or without GAS5 knockdown. The cells were then treated with 20 μg/ml propofol, and cell lysates were analyzed using the indicated antibodies. (O) Flag-GSK3β or the empty vector was transfected into UM-SCC6 cells with or without GAS5 knockdown, and the cells were then treated with 20 μg/ml propofol. Cell lysates were analyzed using the indicated antibodies. For G, H, J, and K, the results are representative of three independent experiments, and the data are shown as the means ± s.d. Student’s t-test, *p < .05, **p < .01, ***p < .001.
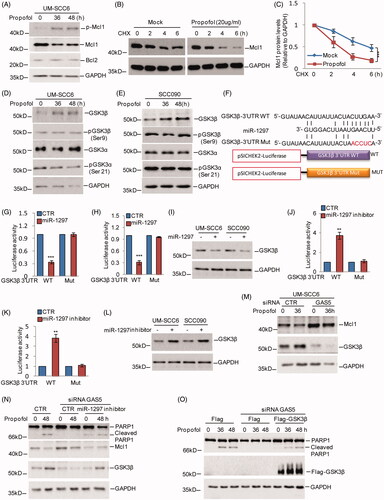
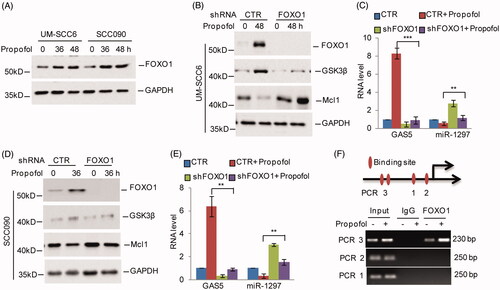
Figure 5. FoxO1 promotes GAS5 expression in response to propofol treatment. (A) UM-SCC6 and SCC090 cells were treated with 20 μg/ml propofol for the indicated times, and the protein levels of FoxO1 were analyzed by western blot. (B–E) UM-SCC6 and SCC090 cells with or without FoxO1 knockdown were treated with 20 μg/ml propofol for the indicated times. The protein levels of FoxO1, GSK3β and Mcl1 were analyzed by western blot. The RNA levels of GAS5 and miR-1297 were analyzed by q-RT-PCR. (F) ChIP analysis shows the binding of FoxO1 to the GAS5 promoter. For C and E, the results are representative of three independent experiments, and the data are shown as the means ± s.d. Student’s t-test, *p < .05, **p < .01, ***p < .001.