
Figures & data
Figure 1. LINC00473 was upregulated in glioma. (A) LINC00473 was highly expressed in glioma tissues than normal tissues. (B and C) LINC00473 was upregulated in glioma patients with advanced WHO grade (III–IV) and low KPS score. (D and E) High LINC00473 expression was associated with poor OS and DFS in glioma patients. (F) LINC00473 was highly expressed in glioma cell lines (LN229, LN18, LN308, U87, U251 and SNB19) compared to NHA cells. *p < .05.
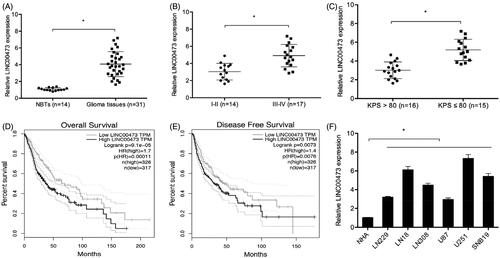
Figure 2. LINC00473 suppression reduced glioma cells progression. (A) si-LINC00473 transfection efficiency detected by qRT-PCR in LN18 and U251 cells. (B and C) LINC00473 suppression reduced LN18 and U251 cells proliferation and colony numbers. (D) LINC00473 inhibition decreased the invasion capacity of LN18 and U251 cells. (E -H) MMP9, E-cadherin, and N-cadherin expression in LN18 and U251 cells transfected with si-LINC00473 or si-NC. *p < .05.
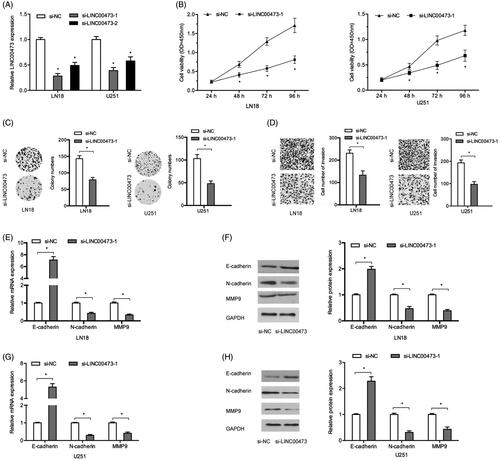
Figure 3. LINC00473 acted as a sponge of miR-637 in glioma cells. (A and B) lncLocator and qRT-PCR showed that LINC00473 is located in the cytoplasm. (C) LINC00473 information and the binding sites between miR-637 and LINC00473. (D) miR-637 mimics reduced the luciferase activity of the Wt-LINC00473 group. (E) RIP assay revealed that LINC00473 and miR-637 expression were both enriched in the immunoprecipitation. (F) LINC00473 inhibition increased miR-637 expression in LN18 and U251 cells. (G) miR-637 was decreased in glioma tissues. (H and I) Low miR-637 expression was correlated with high WHO grade (III–IV) and low KPS score. (J) High LINC00473 expression was negatively correlated with miR-637 expression in glioma tissues. *p < .05.
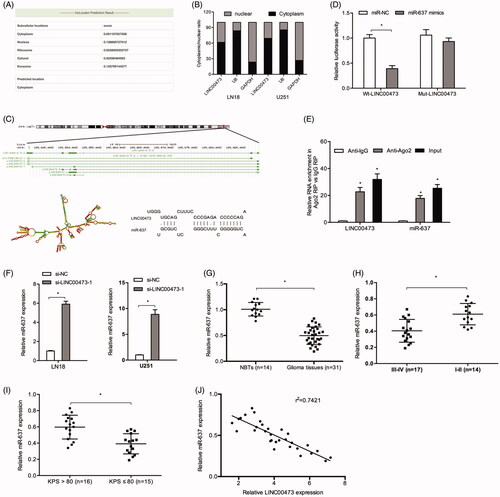
Figure 4. CDK6 was targeted by miR-637. (A) Predicted binding sites between miR-637 and CDK6. (B and C) CDK6 was upregulated in glioma tissues both in mRNA and protein levels. (D) TCGA database showed that CDK6 expression was upregulated in glioma tissues. (E and F) Kaplan Meier analysis showed that high CDK6 expression was associated with poor OS and DFS of patients with glioma. (G) miR-637 mimics reduced the luciferase activity of the Wt-CDK6 group. (H and I) MiR-637 mimics reduced CDK6 expression both in mRNA and protein levels. (J) CDK6 expression was negatively correlated with miR-637 expression in glioma tissues. *p < .05.
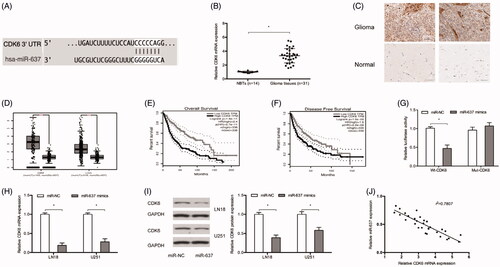
Figure 5. LINC00473/miR-637/CDK6 axis in glioma progression. (A and B) The effects of LINC00473 suppression on CDK6 could be reversed by miR-637 inhibitors in LN18 cells. (C) LINC00473 expression was positively correlated with CDK6 expression in glioma tissues. (D and E) LINC00473 inhibition on LN18 cells proliferation and invasion could be rescued by miR-637 inhibitors. (F and G) The effects of LINC00473 inhibition on E-cadherin, N-cadherin and MMP9 expression could be rescued by miR-637 inhibitors in LN18 cells. *p < .05.
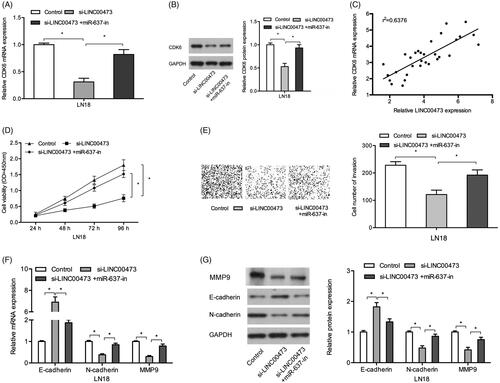
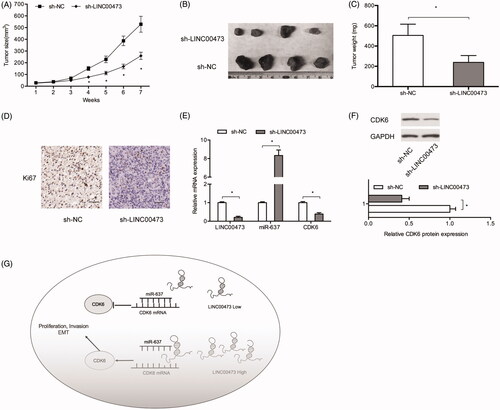
Figure 6. LINC00473 inhibition reduced tumor growth in vivo. (A–C) LINC00473 downregulation reduced tumor growth and weights in vivo. (D) Ki67 expression was determined by IHC in xenograft tissues. (E) Relative expression of LINC00473, miR-637 and CDK6 in xenograft tissues was determined by qRT-PCR. (F) CDK6 expression in xenograft tissues was determined by Western blot. (G) Schematic diagram of LINC00473/miR-637/CDK6 axis in glioma. *p < .05.
Availability of data and materials
The dataset supporting the conclusions of this article is included within the article.