Figures & data
Figure 1. miR-217 targets the 3′-UTR of PRSS3 in PC cells. (A) The mutant status of PRSS3 in PC patients from TCGA database. (B) The mRNA expression of PRSS3 in PC patients with different types of copy number variations. (C) The correlation between PRSS3 expression and methylation level in PC tissues. (D) The diagrammatic sketch showing the binding site between 3′-UTR of PRSS3 and miR-217. (E) The relative luciferase activities of wild-type and mutated PRSS3 3′-UTR luciferase vectors co-transfected with control or miR-217 mimics in MiaPaca2 cells. (F) qRT-PCR analysis for miR-217 expression in PC and matched normal tissues. (G, H) qRT-PCR analysis for miR-217 expression in PC patients with different TNM stage (I and II versus III and IV) (G) and lymph node status (no metastasis versus metastasis) (H). (I) The overall survival curves of PC patients with low and high miR-217 expression. UTR: untranslated region; LN: lymph node; ***p < .001.
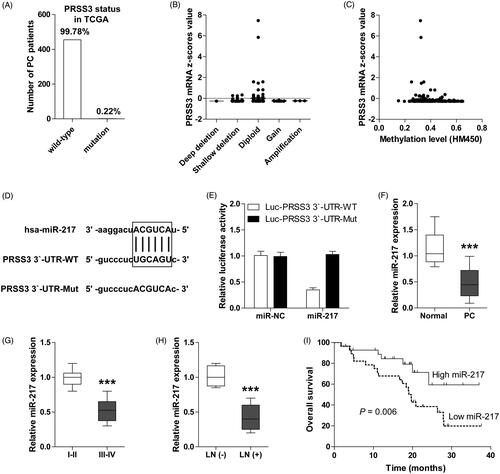
Figure 2. miR-217 inhibits the aggressive phenotype of PC cells by targeting PRSS3. (A) qRT-PCR analysis for miR-217 expression in PC cell lines. (B, C) qRT-PCR analysis for miR-217 and PRSS3 expression in miR-217-knockdown MiaPaca2 (B) and miR-217-overexpressing Capan1 cells (C). (D) Western blot analysis for PRSS3 expression in miR-217-knockdown/overexpressing MiaPaca2/Capan1 cells. GAPDH was used as a control reference. (E) The correlation between miR-217 and PRSS3 expression in PC tissues. (F, G) CCK-8 proliferation assays in miR-217-knockdown MiaPaca2 cells (F) or in miR-217-overexpressing Capan1 cells (G) transfected with PRSS3 small interfering RNA or PRSS3 expression plasmid. (H,I) Transwell migration and invasion assays in miR-217-knockdown MiaPaca2 cells or in miR-217-overexpressing Capan1 cells transfected with PRSS3 small interfering RNA (H) or PRSS3 expression plasmid (I). **p < .01.
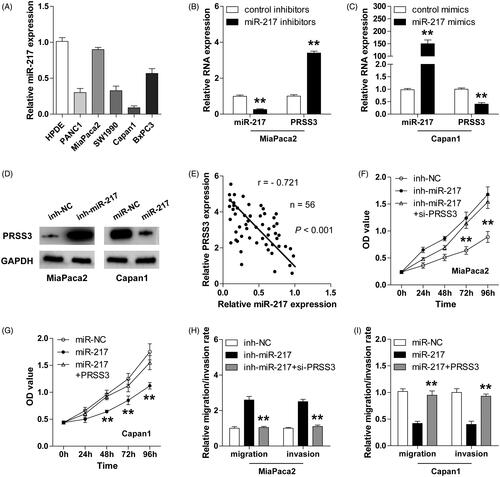
Figure 3. miR-217 is absorbed and inhibited by circ-ADAM9 in PC cells. (A) The top five miR-217-associated circRNAs predicted by starBase V2.0 online program. (B,C) RNA pull-down assay in MiaPaca2 (B) and Capan1 (C) cells transfected with biotin-labelled miR-217 or control probe, followed by qRT-PCR analysis for the expression of the indicated circRNAs. (D) The diagrammatic sketch showing the binding site between circ-ADAM9 and miR-217. (E,F) The relative luciferase activities of wild-type and mutated circ-ADAM9 luciferase vectors co-transfected with control or miR-217 mimics in MiaPaca2 (E) and Capan1 (F) cells. (G,H) qRT-PCR analysis for the expression of circ-ADAM9 and miR-217 in circ-ADAM9-overexpressing MiaPaca2 (G) and circ-ADAM9-silencing Capan1 cells (H). (I) The correlation between circ-ADAM9 and miR-217 expression in PC tissues. **p < .01.
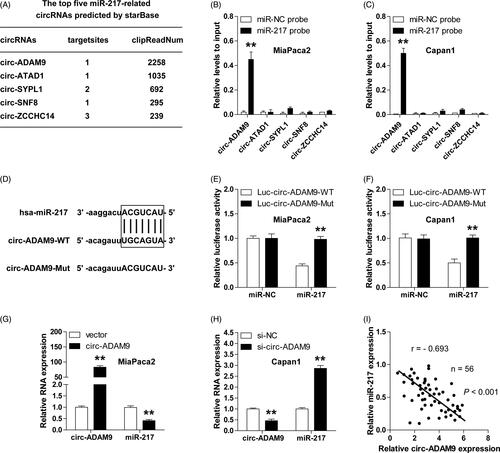
Figure 4. Overexpressed circ-ADAM9 is identified in PC cell lines and tissues and predicts poor outcome. (A,B) qRT-PCR analysis for the expression of circ-ADAM9 in PC cell lines (A) and tissues (B). (C,D) qRT-PCR analysis for circ-ADAM9 expression in PC patients with different TNM stage (I and II versus III and IV) (C) and lymph node status (no metastasis versus metastasis) (D). (E) The overall survival curves of PC patients with low and high circ-ADAM9 expression. LN: lymph node; ***p < .001.
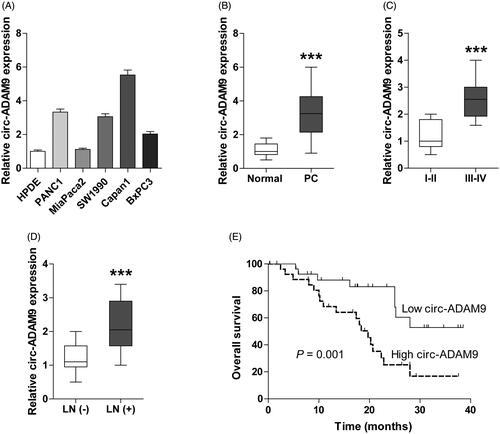
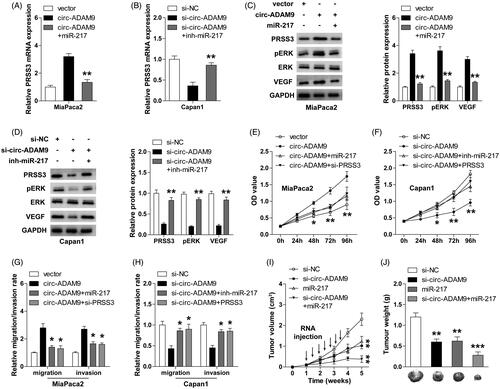
Figure 5. The ceRNA network of circ-ADAM9/miR-217/PRSS3 axis contributes to the progression of PC through activating ERK/VEGF signalling pathway. (A,B) qRT-PCR analysis for PRSS3 mRNA expression in circ-ADAM9-overexpressing MiaPaca2 or circ-ADAM9-silencing Capan1 cells co-transfected with miR-217 mimics (A) or inhibitors (B). (C,D) Western blot analysis for the protein expression of PRSS3, pERK, ERK, VEGF in circ-ADAM9-overexpressing MiaPaca2 or circ-ADAM9-silencing Capan1 cells transfected with miR-217 mimics (C) or inhibitors (D). (E,G) CCK-8 proliferation (E) and transwell (G) assays in circ-ADAM9-overexpressing MiaPaca2 cells with or without miR-217 overexpression or PRSS3 knockdown. (F,H) CCK-8 proliferation (F) and transwell (H) assays in circ-ADAM9-silencing Capan1 cells with or without PRSS3 overexpression or miR-217 knockdown. (I,J) The volume (I) and weight (J) of tumours in the indicated groups. The black arrows denote the time and number of specific intratumoural injections of cholesterol-conjugated oligonucleotides. *p < .05, **p < .01 and ***p < .001.