
Figures & data
Figure 1. H2A.XY39ph was regulated via Ras-ERK1/2 signalling. MP65 cells were transfected with pEGFP-N1 vector (an empty plasmid), RasG12D/T35S plasmid, or Ras WT plasmid. H2A.XY39ph expression was examined through (A) Western blot followed by (B) densitometry analysis. **p < .01 (n = 3), pEGFP-N1 versus RasG12D/T35S. (C) ERK1/2 expression was measured by Western blot.
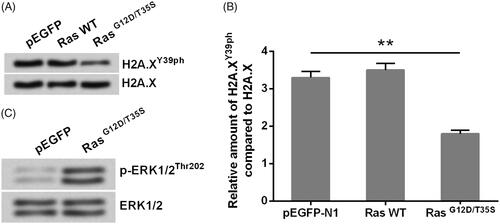
Figure 2. Silence of H2A.XY39ph contributed to the regulation of uveal melanoma cell phenotypes. pEGFP-H2A.X, RasG12D/T35S plasmid, or increasing amounts of H2A.XY39A plasmid (0.5, 1, and 2 g) were transfected into MP65 cells. H2A.XY39A plasmids were constructed to mimic H2A.XY39ph. (A) OD values in MTT assay reflected cell viability. (B) Colonies numbers were measured through soft-agar colony formation experiment. (C) OD values in Transwell assay reflected cell migration. **p < .01, Ras + H2A.X versus Ras + H2A.XY39A, ***p < .001 (n = 3).
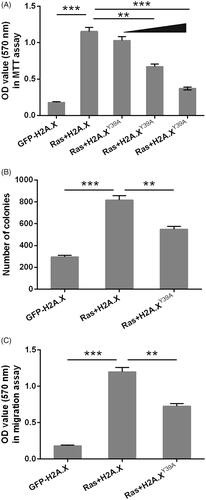
Figure 3. H2A.XY39ph modulated ERK1/2 downstream genes’ transcription. (A) RNA levels of several genes were tested through qRT-PCR after transfection with pEGFP-H2A.X, RasG12D/T35S plasmid + pEGFP-H2A.X, or RasG12D/T35S plasmid + pEGFP-H2A.X Y39A, respectively. (B) These genes’ transcription was examined through ChIP assay after transfection with pEGFP-H2A.X, or RasG12D/T35S plasmid + pEGFP-H2A.X. *p < .05, **p < .01, GFP + H2A.X versus Ras + H2A.X, Ras + H2A.X versus Ras + H2A.XY39A, ***p < .001 (n = 3).
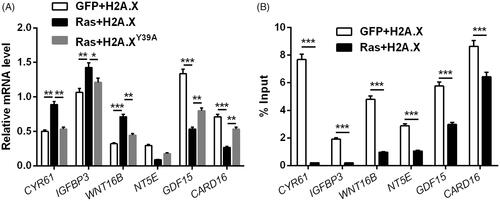
Figure 4. Overexpression of JMJD6 recovered H2A.XY39ph expression and uveal melanoma cell phenotypes. (A) JMJD6-HA (a HA-tagged plasmid for expression of JMJD6) or an empty vector was transfected into MP65 cells. Gel electrophoresis showed the mRNA level of JMJD6. (B) RasG12D/T35S plasmid, JMJD6-HA, or empty vector was transfected into MP65 cells. The expression of H2A.XY39ph was examined through Western blot. (C) Cell activity was examined through MTT experiment. (D) Colonies numbers were measured through soft-agar colony formation experiment, and (E) cell cycle progression tested through flow cytometry were done after transfection with RasG12D/T35S plasmid, JMJD6-HA (with raising concentrations, i.e. 0.5 and 1 g), or empty vector. *p < .05, ***p < .001 (n = 3).
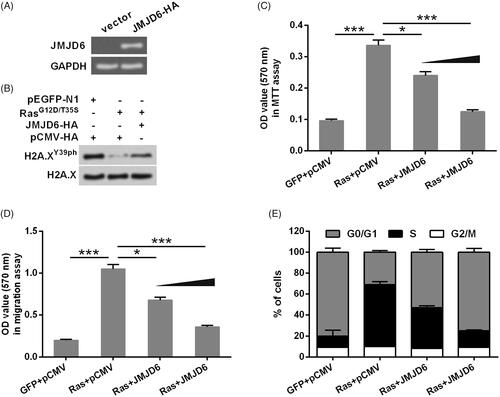
Figure 5. Activation of ERK1/2 induced the degradation of JMJD6 and led to the down-regulation of H2A.XY39ph. (A) RasG12D/T35S plasmid or an empty vector was transfected into MP65 cells. Gel electrophoresis showed the mRNA level of JMJD6. (B) MP65 cells were transfected with JMJD6-HA, RasG12D/T35S plasmid or empty vector. JMJD6 expression was examined through Western blot. (C) RasG12D/T35S plasmid or an empty vector was transfected into MP65 cells. Protein levels of JMJD6 and H2A.XY39ph were examined through Western blot analysis. (D) If JMJD6 bind with the promoter of ERK1/2 downstream genes was examined through ChIP experiment. (E) JMJD6 expression was measured through Western blot after treating with MG132. (F) H2A.XY39ph expression was measured through Western blot after 0–60 h transfection. (G) H2A.XY39ph expression was examined through Western blot after treating with MG132 for 0–12 h. *p<.05, **p<.01, GFP versus Ras, ***p<.001 (n = 3).
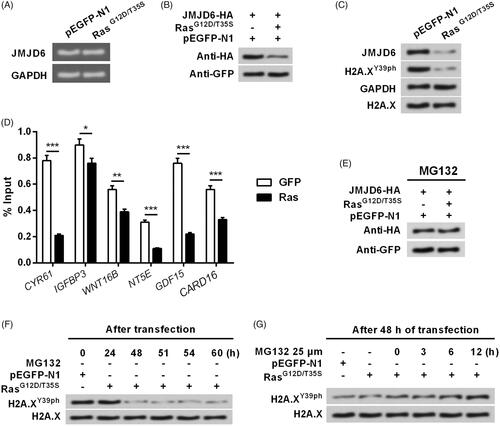
Figure 6. Activation of ERK1/2 degraded JMJD6 via modulating MDM2. RasG12D/T35S, JMJD6-HA, MDM2-His (a His-tagged plasmid for expression of MDM2), or empty vector was transfected into MP65 cells. (A) Exogenous and (B) endogenous expression of JMJD6 was examined through Western blot. MDM2-His was treated with increasing concentrations (0.5, 1.0 and 2.0 g). Subsequently, MDM2-His or MDM2-MU (the mutated MDM2) were transfected into cell and the (C) exogenous and (D) endogenous expression of JMJD6 was measured through Western blot. (E) The expression of MDM2 and H2A.XY39ph were examined after transfection. (F) siRNA transfection was done to repress MDM2 expression. (G) The expression changes of H2A.XY39ph were tested when MDM2 was silenced. All protein levels were tested by Western blot analysis.
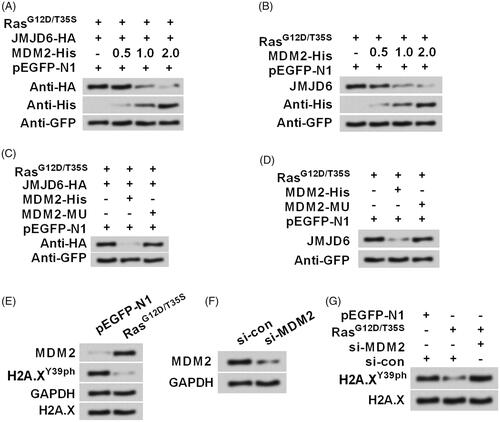
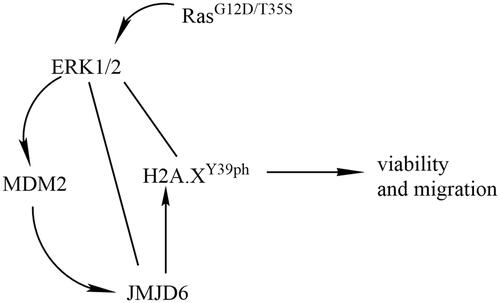
Figure 7. Diagram was made to explain how Ras-ERK1/2 and JMJD6-MDM2 regulate H2A.XY39ph.
Data availability
The datasets used and/or analyzed during the current study are available from the corresponding author on reasonable request.