Figures & data
Figure 1. Chemical structures of (A) emodin (B) RADA16-I (C) RVDV16-I.
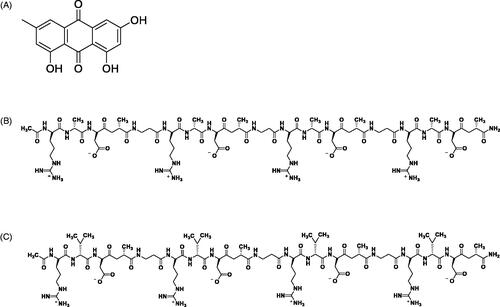
Figure 2. The UV spectrum of EM.
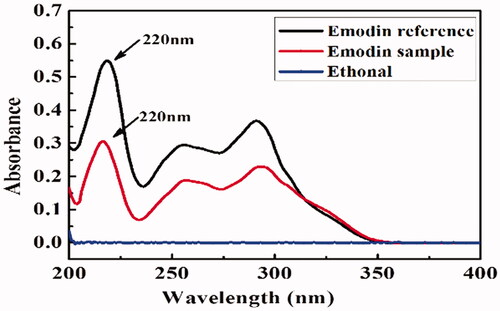
Table 1. Solubility of EM at different medium.
Table 2. The sequences and characteristics of the two peptides.
Figure 3. Emission spectra of EM at the excitation wavelength of 254 nm in self-assembling peptide aqueous solutions and in water under mechanically stirring. (A) RADA16-I; (B) RVDV16-I; (C) Water; (D) Fluorescence intensity of EM at 509 nm; [EM] = 6.0 μg/mL, [RADA16-I] = [RVDV16-I] = 100 μM.
![Figure 3. Emission spectra of EM at the excitation wavelength of 254 nm in self-assembling peptide aqueous solutions and in water under mechanically stirring. (A) RADA16-I; (B) RVDV16-I; (C) Water; (D) Fluorescence intensity of EM at 509 nm; [EM] = 6.0 μg/mL, [RADA16-I] = [RVDV16-I] = 100 μM.](/cms/asset/a77e4ec4-2cb3-4bd8-90b4-b14e447508a5/ianb_a_1673768_f0003_c.jpg)
Figure 4. Fluorescence spectra of EM in different concentration of RADA16-I and RVDV16-I. (A) RADA16-I; (B) RVDV16-I. [EM] = 6.0 μg/mL, [RADA16-I] = [RVDV16-I] = 0–200 μM.
![Figure 4. Fluorescence spectra of EM in different concentration of RADA16-I and RVDV16-I. (A) RADA16-I; (B) RVDV16-I. [EM] = 6.0 μg/mL, [RADA16-I] = [RVDV16-I] = 0–200 μM.](/cms/asset/95e667ec-0bcb-4d07-aa49-5e6f1d73ff58/ianb_a_1673768_f0004_c.jpg)
Figure 5. Secondary structures of RADA16-I, RVDV16-I, RADA16-I-EM and RVDV16-I-EM complexes. The concentrations of RADA/RVDV16-I in RADA/RVDV16-I-EM-1, RADA/RVDV16-I-EM-2, RADA/RVDV16-I-EM-3 were 0.1, 0.2, 0.4 mg/mL, respectively, [EM] = 0.05 mg/mL.
![Figure 5. Secondary structures of RADA16-I, RVDV16-I, RADA16-I-EM and RVDV16-I-EM complexes. The concentrations of RADA/RVDV16-I in RADA/RVDV16-I-EM-1, RADA/RVDV16-I-EM-2, RADA/RVDV16-I-EM-3 were 0.1, 0.2, 0.4 mg/mL, respectively, [EM] = 0.05 mg/mL.](/cms/asset/4a5f28e7-927c-4cd6-80ac-fa64eec71118/ianb_a_1673768_f0005_c.jpg)
Figure 6. AFM images of RADA16-I, RVDV16-I, RADA16-I-EM and RVDV16-I-EM complexes in aqueous solutions. (A) RADA16-I, (B) RADA16-I-EM, (C) RVDV16-I, (D) RVDV16-I-EM, peptide concentration: [RADA16-I] = [RVDV16-I] = 200 μM, [EM] = 0.1 μM.
![Figure 6. AFM images of RADA16-I, RVDV16-I, RADA16-I-EM and RVDV16-I-EM complexes in aqueous solutions. (A) RADA16-I, (B) RADA16-I-EM, (C) RVDV16-I, (D) RVDV16-I-EM, peptide concentration: [RADA16-I] = [RVDV16-I] = 200 μM, [EM] = 0.1 μM.](/cms/asset/c9b077ab-39b0-4e15-91d4-7cced8634061/ianb_a_1673768_f0006_c.jpg)
Figure 7. Formation of colloidal suspensions of EM in RADA16-Ior RVDV16-I aqueous solution. (A) In water; (B) In RADA16-I; (C) In RVDV16-I; [EM] = 1.0 mg/mL, [RADA16-I] = [RVDV16-I] = 1.0 mg/mL.
![Figure 7. Formation of colloidal suspensions of EM in RADA16-Ior RVDV16-I aqueous solution. (A) In water; (B) In RADA16-I; (C) In RVDV16-I; [EM] = 1.0 mg/mL, [RADA16-I] = [RVDV16-I] = 1.0 mg/mL.](/cms/asset/e353b23b-cbc3-4b85-90d8-cb0e99012122/ianb_a_1673768_f0007_c.jpg)
Figure 8. SEM images of the peptide-EM suspensions at different concentration of RADA16-I and RVDV16-I. (A) EM aqueous suspension without peptide; (B, C, D) RADA16-I-EM; (E, F, G) RVDV16-I-EM. [EM] = 0.10 mg/mL; from left to right, peptide concentrations were 0.05, 0.1, 1.0 mg/mL, respectively.
![Figure 8. SEM images of the peptide-EM suspensions at different concentration of RADA16-I and RVDV16-I. (A) EM aqueous suspension without peptide; (B, C, D) RADA16-I-EM; (E, F, G) RVDV16-I-EM. [EM] = 0.10 mg/mL; from left to right, peptide concentrations were 0.05, 0.1, 1.0 mg/mL, respectively.](/cms/asset/d502caa4-0f52-4dd7-82ef-4b4363883c81/ianb_a_1673768_f0008_b.jpg)
Figure 9. Particle size distribution in suspensions of EM with and without self-assembling peptides. (A) size distribution; (B) average size and PDI. [EM] = 0.5 mg/mL, [RADA16-I] = [RVDV16-I] = 1.0 mg/mL. *p < .05, average particle size vs average particle size in water suspension; #p < .05, PDI vs PDI in water suspension.
![Figure 9. Particle size distribution in suspensions of EM with and without self-assembling peptides. (A) size distribution; (B) average size and PDI. [EM] = 0.5 mg/mL, [RADA16-I] = [RVDV16-I] = 1.0 mg/mL. *p < .05, average particle size vs average particle size in water suspension; #p < .05, PDI vs PDI in water suspension.](/cms/asset/b59e20e0-3ee9-43a4-97ab-20f83cf52fef/ianb_a_1673768_f0009_c.jpg)
Figure 10. (A) The suspension rate of EM in RADA16-I and RVDV16-I solution ( ± s, n = 3). [EM] = 0.5 mg/mL, [RADA16-I] = [RVDV16-I] = 10–100 μM, (B) Solubility of EM at different concentration of RADA16-I and RVDV16-I (
± s, n = 3). [RADA16-I] = [RVDV16-I] = 100–1000 μM. *p < .05, **p < .01 vs in pure water without peptide.
![Figure 10. (A) The suspension rate of EM in RADA16-I and RVDV16-I solution (x¯ ± s, n = 3). [EM] = 0.5 mg/mL, [RADA16-I] = [RVDV16-I] = 10–100 μM, (B) Solubility of EM at different concentration of RADA16-I and RVDV16-I (x¯ ± s, n = 3). [RADA16-I] = [RVDV16-I] = 100–1000 μM. *p < .05, **p < .01 vs in pure water without peptide.](/cms/asset/5865abd6-fec4-479f-82ae-e168cc378729/ianb_a_1673768_f0010_b.jpg)
Figure 11. Formation of in situ hydrogel of RADA16-I and RVDV16-I-EM suspension at PBS and 0.9% NaCl solution; (A) RADA16-EM suspension in PBS; (B) RADA16-I-EM suspension in 0.9% NaCl; (C) RVDV16-I-EM suspension in PBS; (D) RVDV16-I-EM suspension in 0.9% NaCl; [EM] = 1.0 mg/mL, [RADA16-I] = [RVDV16-I] = 5.0 mg/mL.
![Figure 11. Formation of in situ hydrogel of RADA16-I and RVDV16-I-EM suspension at PBS and 0.9% NaCl solution; (A) RADA16-EM suspension in PBS; (B) RADA16-I-EM suspension in 0.9% NaCl; (C) RVDV16-I-EM suspension in PBS; (D) RVDV16-I-EM suspension in 0.9% NaCl; [EM] = 1.0 mg/mL, [RADA16-I] = [RVDV16-I] = 5.0 mg/mL.](/cms/asset/ee219ab1-771e-4f58-b618-100fd844d6f3/ianb_a_1673768_f0011_c.jpg)
Figure 12. SEM images of in situ hydrogels when the peptide solution or the peptide-EM suspension was dropped into pH 7.4 PBS. (A–C) RADA16-I, (D–F) RADA16-I-EM, (G–I) RVDV16-I, (J–L) RVDV16-I-EM, peptide concentration: from left to right were 5, 10, 20 mg/mL, [EM] = 0.5 mg/mL.
![Figure 12. SEM images of in situ hydrogels when the peptide solution or the peptide-EM suspension was dropped into pH 7.4 PBS. (A–C) RADA16-I, (D–F) RADA16-I-EM, (G–I) RVDV16-I, (J–L) RVDV16-I-EM, peptide concentration: from left to right were 5, 10, 20 mg/mL, [EM] = 0.5 mg/mL.](/cms/asset/954c0069-2a17-43ae-8871-b3d9e784ea5d/ianb_a_1673768_f0012_b.jpg)
Figure 13. Rheological properties of RADA16-I, RVDV16-I, RADA16-I-EM and RVDV16-I-EM solution (or suspension) and hydrogels. (A) RADA16-I; (B) RVDV16-I; (C) RADA16-I-EM; (D) RVDV16-I-EM. [EM] = 1.0 mg/mL, [RADA16-I] = [RVDV16-I] = 5 mg/mL.
![Figure 13. Rheological properties of RADA16-I, RVDV16-I, RADA16-I-EM and RVDV16-I-EM solution (or suspension) and hydrogels. (A) RADA16-I; (B) RVDV16-I; (C) RADA16-I-EM; (D) RVDV16-I-EM. [EM] = 1.0 mg/mL, [RADA16-I] = [RVDV16-I] = 5 mg/mL.](/cms/asset/adaa1637-4a29-4c3c-8e79-e644dd528d9b/ianb_a_1673768_f0013_b.jpg)
Figure 14. Rheological properties of peptide-EM hydrogels formed from peptide-EM suspensions with different concentration of RADA16-I and RVDV16-I (A) RADA16-I-EM hydrogel; (B) RVDV16-I-EM hydrogel; (▲, △): 3 mg/mL peptide; (●, ^): 5 mg/mL peptide; (■, □): 7 mg/mL peptide; [EM] = 1.0 mg/mL, [RADA16-I] = [RVDV16-I] = 3, 5, 7 mg/mL.
![Figure 14. Rheological properties of peptide-EM hydrogels formed from peptide-EM suspensions with different concentration of RADA16-I and RVDV16-I (A) RADA16-I-EM hydrogel; (B) RVDV16-I-EM hydrogel; (▲, △): 3 mg/mL peptide; (●, ^): 5 mg/mL peptide; (■, □): 7 mg/mL peptide; [EM] = 1.0 mg/mL, [RADA16-I] = [RVDV16-I] = 3, 5, 7 mg/mL.](/cms/asset/8a9bd2d4-d598-4ede-9f24-e707058e28b7/ianb_a_1673768_f0014_b.jpg)
Figure 15. Release profiles of EM from EM water suspension and in situ peptide-EM hydrogels (n = 3). [EM] = 1.0 mg/mL, [RADA16-I] = [RVDV16-I] = 0, 3, 5, 7 mg/mL (0 mg/mL represents EM water suspension without any peptide).
![Figure 15. Release profiles of EM from EM water suspension and in situ peptide-EM hydrogels (n = 3). [EM] = 1.0 mg/mL, [RADA16-I] = [RVDV16-I] = 0, 3, 5, 7 mg/mL (0 mg/mL represents EM water suspension without any peptide).](/cms/asset/dff5d958-c6b9-480c-842b-6b12d745af70/ianb_a_1673768_f0015_c.jpg)
Figure 16. Proliferation inhibition effects of EM-water suspension and peptide-EM in situ hydrogel on A549 and HepG2 cells. [RADA16-I] = [RVDV16-I] = 5 mg/mL, [EM] = 20, 40, 60, 80, 100, 120,140, 160 μM; Data were calculated from three independent experiments. *p < .05, #p < .01. RADA: self-assembling RADA16-I peptide; RVDV: self-assembling RVDV16-I peptide; EM: emodin.
![Figure 16. Proliferation inhibition effects of EM-water suspension and peptide-EM in situ hydrogel on A549 and HepG2 cells. [RADA16-I] = [RVDV16-I] = 5 mg/mL, [EM] = 20, 40, 60, 80, 100, 120,140, 160 μM; Data were calculated from three independent experiments. *p < .05, #p < .01. RADA: self-assembling RADA16-I peptide; RVDV: self-assembling RVDV16-I peptide; EM: emodin.](/cms/asset/30ac3590-c34a-462a-95c1-f0a4e58f3885/ianb_a_1673768_f0016_b.jpg)
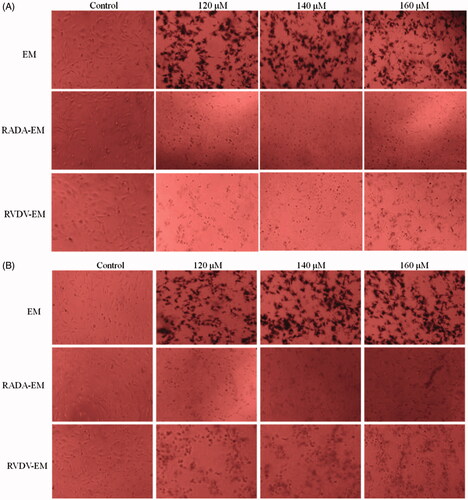
Figure 17. A549 and HepG2 cells incubated with self-assembling peptide-EM hydrogel for 48 h. The morphological changes of A549 and HepG2 cells were observed using microscopy (magnification, ×200). A and B represent A549 and HepG2 cells, respectively. RADA: self-assembling RADA16-I peptide; RVDV: self-assembling RVDV16-I peptide; EM: emodin.