Figures & data
Table 1. Sequences of miR-199a mimics/inhibitors and related controls.
Table 2. The sequence of TNF-α siRNAs.
Table 3. Primers used in reverse transcription and quantitative real-time PCR.
Figure 1. MiR-199a is upregulated in liver tissue at 12–30 h after PH compared to those at SO group and rat hepatocyte BRL-3A. (A) qRT-PCR assay was used to test miR-199a level at 12–30 h after PH and SO. (B) Relative miR-199a levels were tested in rat hepatocyte BRL-3A by qRT-PCR assay. All data are represented as the mean ± SD, *p < .05, **p < .01.
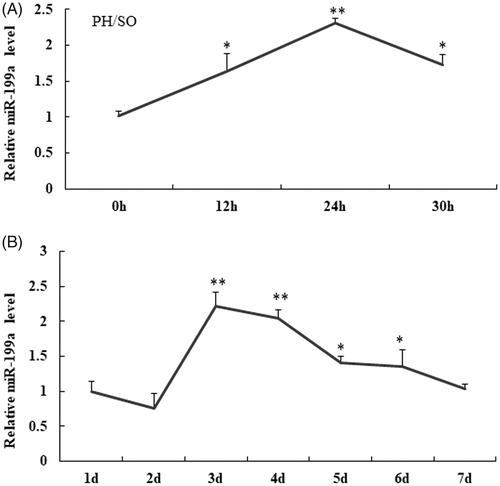
Figure 2. Down-regulate expression of miR-199a inhibits hepatocyte proliferation a. (A, B) qRT-PCR analysis was used to test transfection efficiency of miR-199a mimics (miR-199a-m)/inhibitors (miR-199a-i), or NCs (NC-m, NC-i). (C) CCK-8 kit was used for Cell viability assay. (D) Flow cytometry was used to detect the effect of miR-199a on the cell cycle. (E) Edu (red) assay was used to detect the proliferation of miR-199a in hepatocyte. (F) The percentage of Edu-positive cells was quantified. All data are represented as the mean ± SD, *p < .05, **p < .01.
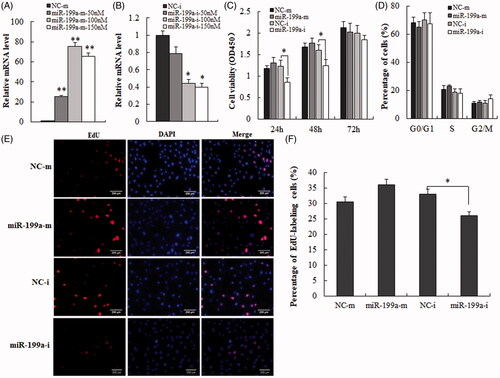
Figure 3. Down-regulate expression of miR-199a promotes hepatocyte apoptosis. (A) Apoptosis analysis of miR-199a in BRL-3A were tested by flow cytometry after treatment with miR-199a inhibitors or NC; (B) Quantification of the cell apoptosis rate in each group. All data are represented as the mean ± SD, *p < .05.
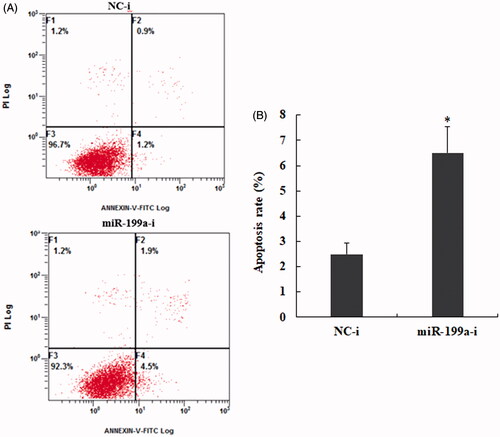
Figure 4. MiR-199a negatively correlates with TNF-α expression at protein level both in vitro and in vivo. (A) qRT-PCR analysis for TNF-α level in liver tissue at 12–30 h after PH (compared with those at SO group). (B) Western blot analysis for TNF-α level in liver tissue at 12–30 h after PH (compared with those at SO group). (C) qRT-PCR analysis for TNF-α expression in BRL-3A after transfection with miR-199a inhibitor (miR-199a-i) or NC-i. (D) Western blot analysis for TNF-α expression in BRL-3A transfected with miR-199a inhibitor (miR-199a-i) or NC-i. β-actin/U6 were used as loading control. All data are represented as the mean ± SD, *p < .05, **p < .01.
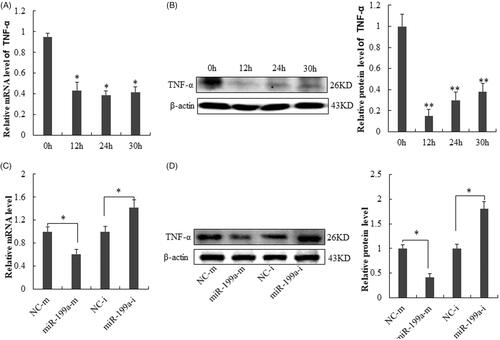
Figure 5. TNF-α is a direct target of miR-199a. (A) The luciferase report analysis for the relative fluorescence level in BRL-3A cells after co-transfection of TNF-α wild-type and mutant 3′UTR with miR-199a mimic/inhibitor. (B) The miR-199a binding site in the 3′UTR of TNF-α and the corresponding mutation site. All data are represented as the mean ± SD, *p < .05.

Figure 6. SiRNA- TNF-α reverses miR-199a inhibition-inhibited cell growth in vitro. (A,B) TNF-α level were measured in BRL-3A after treatment with siRNA- TNF-α (sequence-1,-2 or -3) by qRT-PCR and Western blot analysis. (C) Cell viability assay. (D) Edu (red) cell proliferation assay. (E) The percentage of Edu-positive cells was quantified. The results demonstrated that siRNA- TNF-α reversed the inhibitive effect of miR-199a-i on hepatocyte proliferation. All data are represented as the mean ± SD, *p < .05, **p < .01.
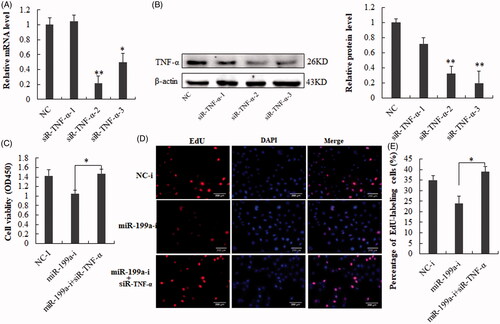
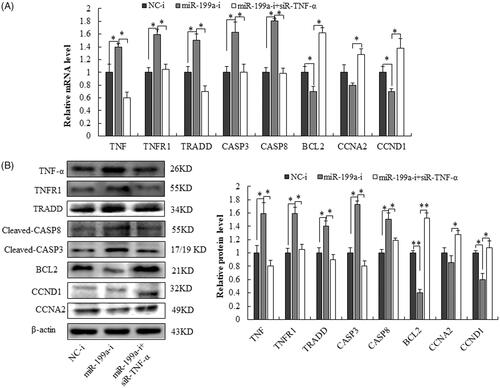
Figure 7. MiR-199a regulates proliferation in rat hepatocyte via TNF-α/TNFR1/TRADD/CASPASE8/CAPASE3 signalling pathway. (A) qRT-PCR analysis for TNF-α, TNFR1, TRADD, CASPASE8, and CAPASE3, BCL2, CCND1 and CCNA2 in rat hepatocyte BRL-3A after co-transfection with siR- TNF-α, miR-199a inhibitor (miR-199a-i) or its negative control (NC-i). (B) Western blot analysis for TNF-α, TNFR1, TRADD, CASPASE8, and CAPASE3, BCL2, CCND1, and CCNA2 in rat hepatocyte BRL-3A after co-transfection with siR-TNF-α, miR-199a inhibitor (miR-199a-i) or its negative control (NC-i). All data are represented as the mean ± SD.*p < .05, **p < .01.