
Figures & data
Figure 1. The conjugation mechanism of PLGA NPs with OPS antigen.
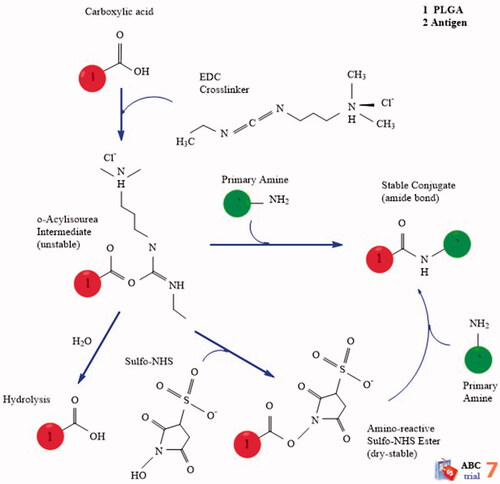
Figure 2. (a) Zeta potential of PLGA nanoparticle and PLGA-OPS conjugate. (b) Size distribution PLGA nanoparticles and OPS–PLGA conjugate.
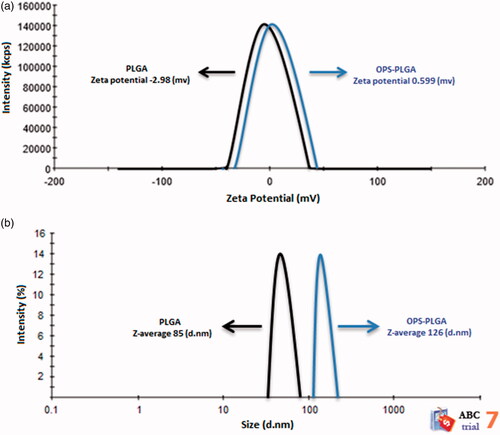
Figure 3. FTIR spectra of (a) PLGA nanoparticles and (b) OPS–PLGA conjugate. The increase in OH group in the PLGA nanoparticles was shown with a red oval.
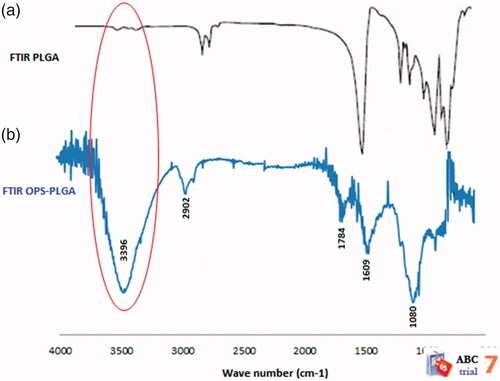
Figure 4. Atomic force microscope images of (a) PLGA nanoparticles surface, (b) three-dimensional image of PLGA nanoparticles, (c) OPS–PLGA conjugate surface and (d) three-dimensional image of OPS–PLGA conjugate.
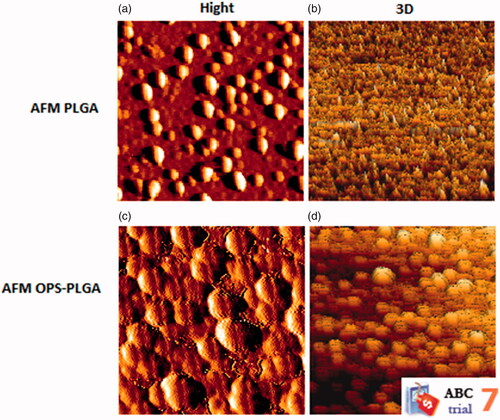
Figure 5. Distribution and kinetics of antibody titres. The IgA (a), IgM (b), IgG (c), IgG1 (d), IgG2a (e), IgG2b (f), IgG3 (g) show the results of serum antibody production against B. melitensis. The values are the average of three replicates (±SD). Different letters represent the meaningful of differences in level p < .001.
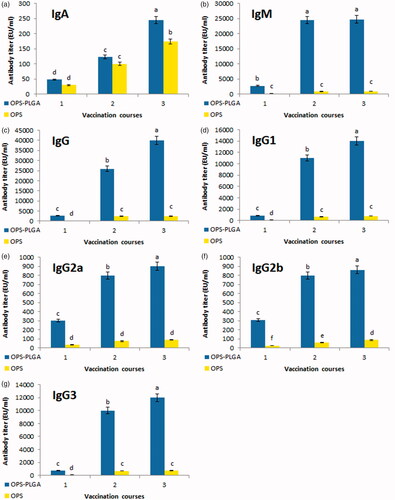
Figure 6. The percentage of bacteria killed in each serum dilution.
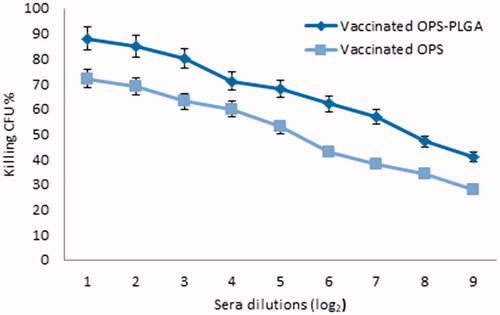
Table 1. Opsonophagocytosis activity of test groups.
Table 2. Level of protection against B. melitensis infection induced by OPS–PLGA conjugate and OPS immunization.