Figures & data
Figure 1. AS-IV is a triterpenoid saponin extracted from Astragalus membranaceus. The molecular formula is C41H68O14.
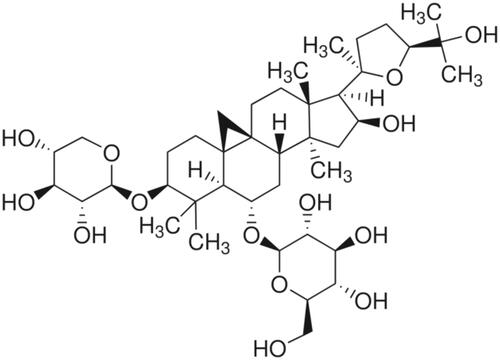
Figure 2. (a) The effect of different concentrations of AS-IV on the viability of HG-damaged H9C2(2-1) cell. X axis: normal group (NG, 5 mM), HG group (HG, 33 mM) and HG combined with different AS-IV concentrations; Y axis: H9C2(2-1) cell viability, absorbance (OD 450 value) by CCK-8 assays; ***p < .001. (b) The effect of miR-34a and AS-IV on the viability of HG-damaged H9C2(2-1) cells. X axis: different intervention groups of H9C2(2-1) cells; Y axis: H9C2(2-1) cell viability, absorbance (OD450 value) by CCK-8 assays; *p < .05, **p < .01.
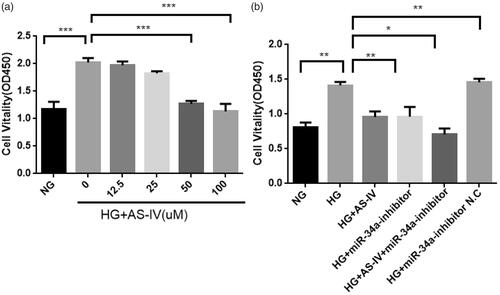
Figure 3. The effect of AS-IV on cell morphology, autophagy flow and autophagosome in HG-damaged H9C2(2-1) cells. (a–f) Changes in cell morphology under different conditions. (g) Representative images of LC3-GFP adenovirus infection monitored the autophagy flow in H9C2(2-1) cells under fluorescent inverted microscope (500× magnification). (h) Representative images of autophagosome obtained by electron microscope. The red arrows refer to the autophagosomes (First row:Scale bar 1 μm, 18500× magnification; Second row:Scale bar 200 nm, 68000× magnification). (i) Statistical graph of LC3-GFP dots/cell for each group of H9C2(2-1) cells. Each group counts autophagosomes in at least 20 cells. Data are shown as mean ± SEM. ***p < .001, ****p < .0001.
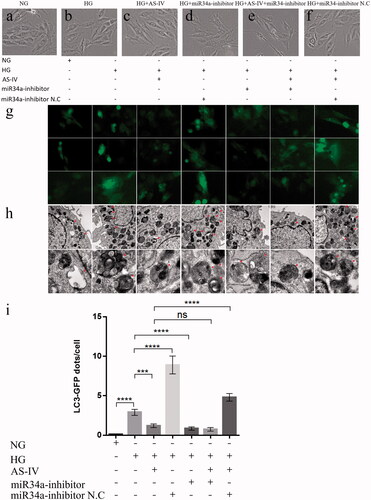
Figure 4. The effect of AS-IV on oxidative stress factors in HG-damaged H9C2(2-1) cells. X axis: different intervention groups of H9C2(2-1) cells; Y axis: LDH, MDA and SOD contents in cell culture supernatant; *p < .05, **p < .01, ***p < .001.
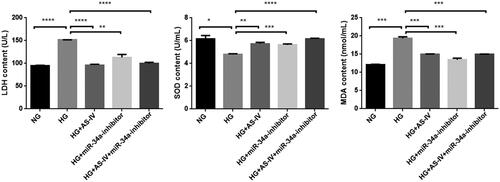
Table 1. Effect of AS-IV on oxidative stress index of H9C2(2-1) cell injury induced by high glucose (Mean ± SEM).
Figure 5. The effect of AS-IV on mRNA expression of autophagy-related factors in HG-damaged H9C2(2-1) cells. X axis: different intervention groups of H9C2(2-1) cells; Y axis: relative mRNA quantity of target gene was compared with internal reference gene GAPDH; **p < .01, ***p < .001.
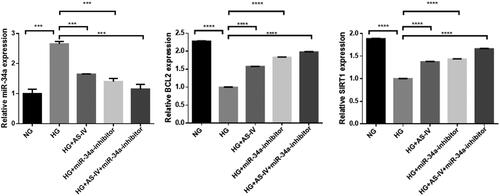
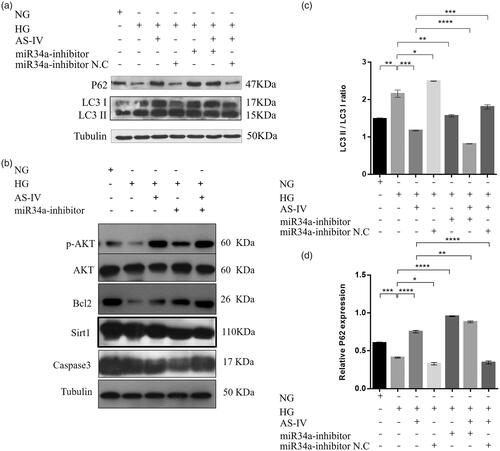
Figure 6. The effect of AS-IV on autophagy-related factor protein levels. (a,b) Western blot analysis showing the levels of the autophagy-related factors LC3I, LC3II, P62, Bcl-2, pAKT, AKT, Sirt1 and caspase3. Tubulin was used as loading control. (c,d) Histograms showed the relative proteins expression of LC3II/LC3I ratio and P62 in each intervention group; *p < .05, **p < .01, ***p < .001.