Figures & data
Scheme 1. (A) Preparation of Fe3O4/DOX/PLGA-PEG nanoparticles via the emulsion solvent evaporation method. (B) A schematic illustration for Fe3O4/DOX/PLGA-PEG nanocarriers system and then Dox release from nanocarriers to kill tumour cells with a dual function of the early diagnosis and the treatment of the tumours.
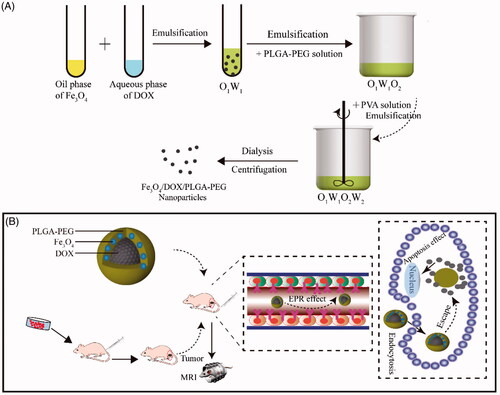
Figure 1. (A) FT-IR spectra of Fe3O4、DOX、PLGA-PEG and Fe3O4/DOX/PLGA-PEG. (B) 1HNMR spectra of PLGA-PEG and characterization of Fe3O4 and Fe3O4/DOX/PLGA-PEG nanocomposites. TEM image of (C) Fe3O4 and (D) Fe3O4/DOX/PLGA-PEG, Particle size distribution of (E) Fe3O4 and (F) Fe3O4/DOX/PLGA-PEG.
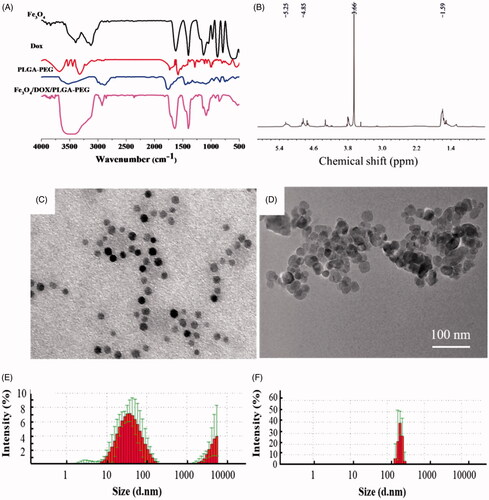
Figure 2. (A) Thermogravimetric chart of PLGA-PEG and Fe3O4/DOX/PLGA-PEG. (B) Cumulative DOX release profiles from Fe3O4/DOX/PLGA-PEG under 37 °C and the standard curve of DOX. (C) Cell viabilities of on 3T3 cells after incubation of various concentrations of PLGA-PEG nanocomposites for 24 h, as determined by the typical CCK-8 assay.
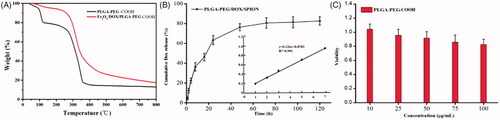
Figure 3. Effect of PLGA-PEG on haemolysis (A), APTT and PT with PBS as a control (B).
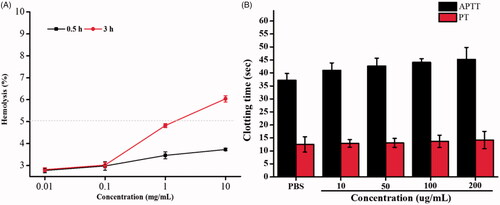
Figure 4. (A) MRI image of different concentrations of Fe3O4 nanoparticles. (B) R2 and R2* relaxometry rates of different concentrations of Fe3O4 nanoparticles.
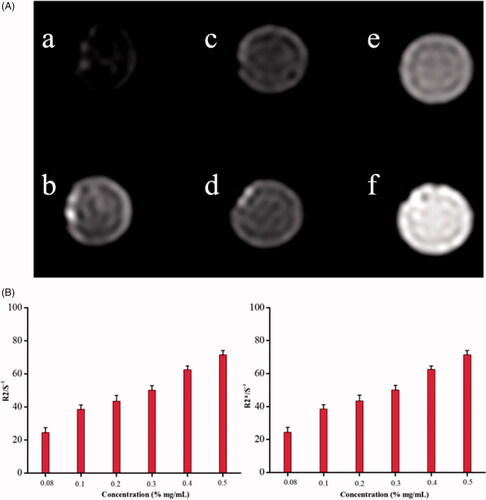
Figure 5. (A) MRI image of different concentrations of Fe3O4/DOX/PLGA-PEG. (B) R2 and R2* relaxometry rates of different concentrations of Fe3O4/DOX/PLGA-PEG nanoparticles.
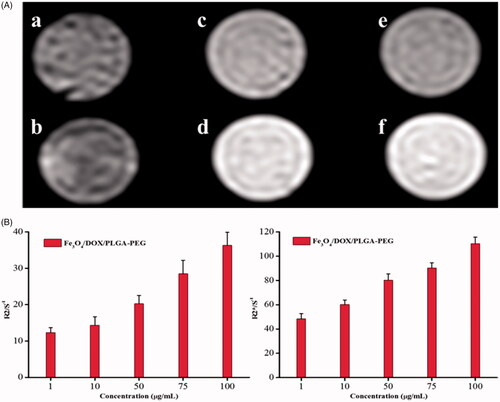
Figure 6. In vitro cell viability analysis. Viability of MCF-7 cells treated with DOX and Fe3O4/DOX/PLGA-PEG complexes for 24 h.
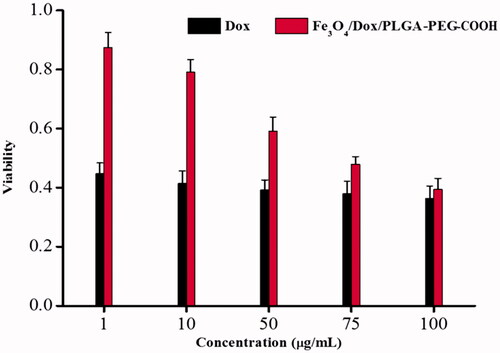
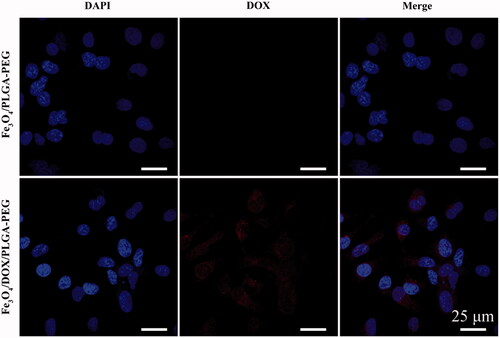
Figure 7. Confocal images of the cellular uptake induced by Fe3O4/DOX/PLGA-PEG in MCF-7 cells: Nucleus were stained with DAPI (blue), DOX (red) image and Merge image.