Figures & data
Figure 1. Montelukast treatment increased the expression of PGC-1α in Beas-2b cells. (A–B) Beas-2b cells were stimulated with montelukast (5, 10, and 20 µM) for 24 h. Expression of PGC-1α was measured (*, p < .01 vs. vehicle group; #, p < .01 vs. 5 µM montelukast group; $, p < .01 vs. 10 µM montelukast group, n = 5–6).
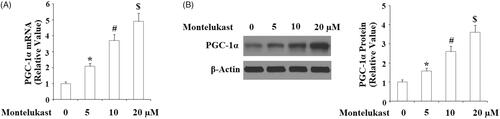
Figure 2. Montelukast treatment increased the expression of NRF-1 and TFAM in Beas-2b cells. (A–B) Beas-2b cells were treated with 10 µM montelukast for 24 h. Expression of NRF-1 and TFAM was measured (*, p < .01 vs. vehicle group, n = 5–6).
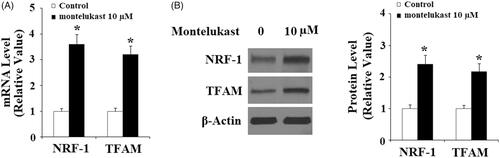
Figure 3. Montelukast treatment promoted mitochondrial biogenesis in Beas-2b cells. Cells were stimulated with 10 µM montelukast for 24 h. (A) Mitochondrial mass; (B) mtDNA/nDNA; (C) Expression of cytochrome B (*, p < .01 vs. vehicle group, n = 5–6).
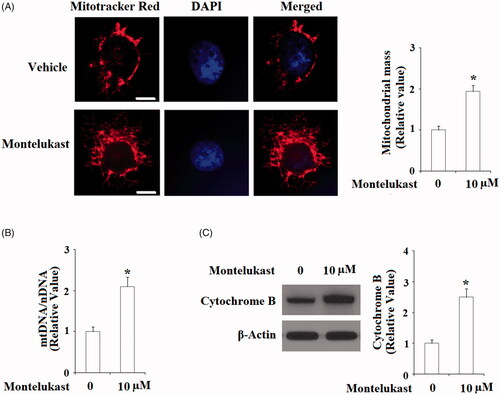
Figure 4. Montelukast treatment induced a gain in mitochondrial function in Beas-2b cells. Cells were stimulated with 10 µM montelukast for 24 h. (A). Representative results of oxygen content consumption in non-treated (blue curve) and montelukast-treated (purple curve) Beas-2b cells; (B). Summarized mitochondrial respiratory rate (*, p < .01 vs. vehicle group, n = 6).
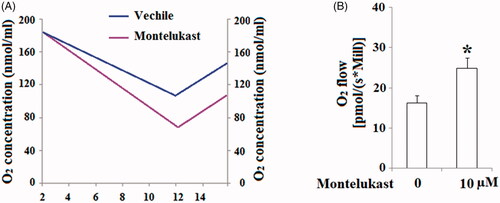
Figure 5. Montelukast treatment increased the production of ATP in Beas-2b cells. Cells were stimulated with 10 µM montelukast for 24 h. ATP production was measured (*, p < .01 vs. vehicle group, n = 6).
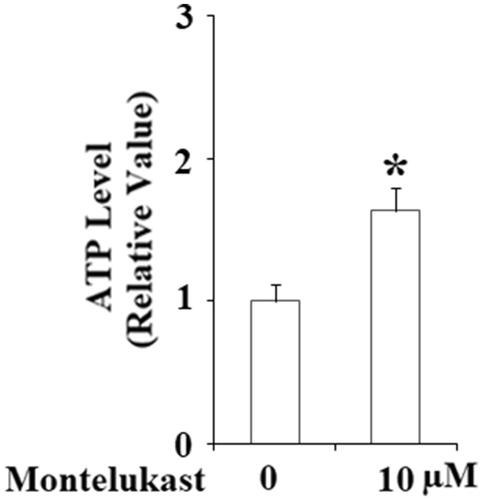
Figure 6. Montelukast-induced generation of cAMP in Beas-2b cells. Cells were stimulated with 10 µM montelukast for 1 h. Intracellular levels of cAMP were determined (*, p < .01 vs. vehicle group, n = 6).
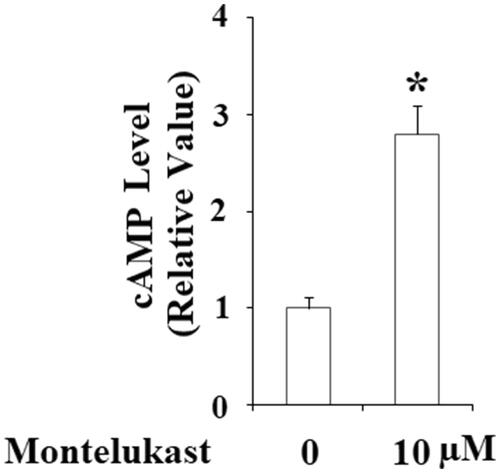
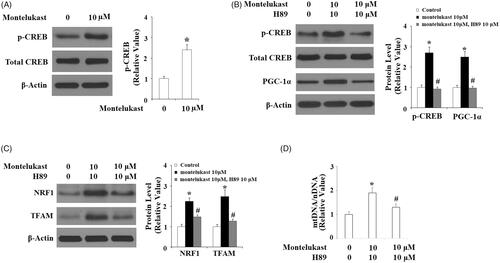
Figure 7. Montelukast-induced expression of PGC-1α in Beas-2b cells is mediated by cAMP/CREB. (A) Beas-2b cells were stimulated with 10 µM montelukast for 1 h. Phosphorylated and total levels of CREB were determined; (B) Cells were stimulated with 10 µM montelukast with or without H89 (10 μM) for 24 h. The expressions of phosphorylated CREB, total CREB and PGC-1α were measured by western blot analysis; (C) Beas-2b cells were stimulated with 10 µM montelukast with or without H89 (10 μM) for 24 h. The expressions of NRF1 and TFAM were measured by western blot analysis; (D) Beas-2b cells were stimulated with 10 µM montelukast with or without H89 (10 μM) for 24 h. mtDNA/nDNA was determined (*, #, p < .01 vs. previous column group, n = 6).