Figures & data
Figure 1. The process of searching for eligible articles.
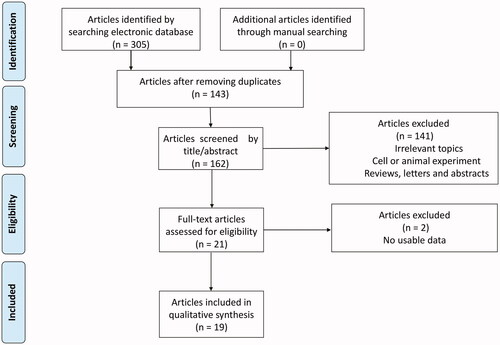
Table 1. The main characteristics of included studies.
Figure 2. Forest plot of the combined HR for the relationship between ECT2 expression and OS in cancer patients. CI: confidence interval; HR: hazard ratio; OS: overall survival; ECT2: epithelial cell transforming sequence 2.
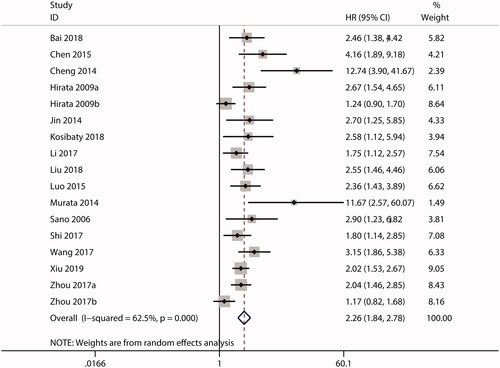
Figure 3. Forest plot of the combined HR for the relationship between ECT2 expression and RFS in cancer patients. CI: confidence interval; HR: hazard ratio; RFS: recurrence-free survival; ECT2: epithelial cell transforming sequence 2.
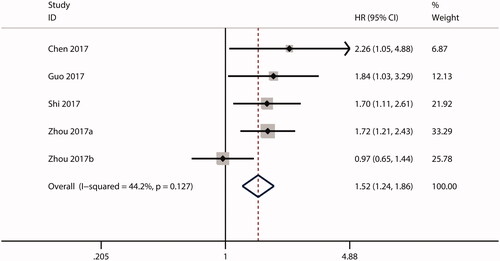
Figure 4. Forest plot of the OR for the relationship of ECT2 expression to gender. OR: odds ratio; ECT2: epithelial cell transforming sequence 2.
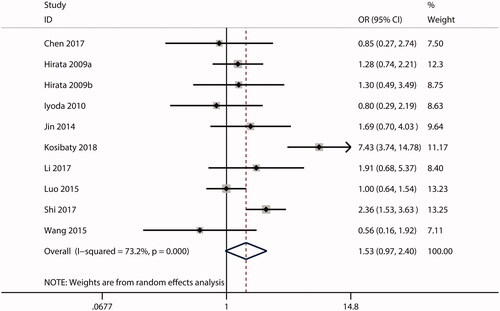
Figure 5. Forest plot of the OR for the relationship of ECT2 expression to age. OR: odds ratio; ECT2: epithelial cell transforming sequence 2.
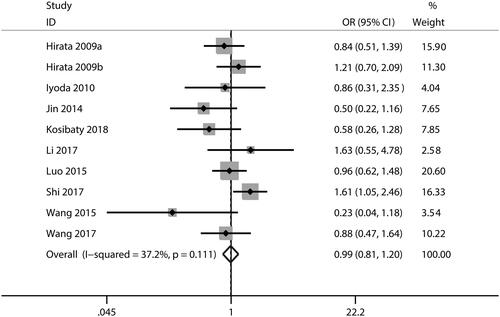
Figure 6. Forest plot of the OR for the relationship of ECT2 expression to TNM stage. OR: odds ratio; ECT2: epithelial cell transforming sequence 2.
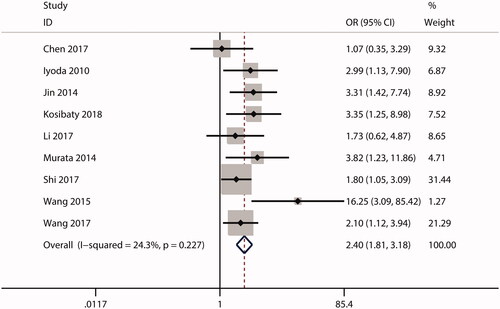
Figure 7. Forest plot of the OR for the relationship of ECT2 expression to lymph node metastasis. OR: odds ratio; ECT2: epithelial cell transforming sequence 2.
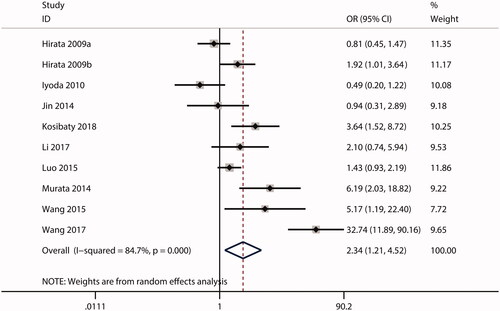
Figure 8. Forest plot of the OR for the relationship of ECT2 expression to tumour differentiation. OR: odds ratio; ECT2: epithelial cell transforming sequence 2.
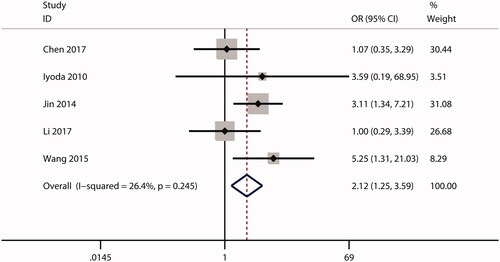
Figure 9. Forest plot of the OR for the relationship of ECT2 expression to distant metastasis. OR: odds ratio; ECT2: epithelial cell transforming sequence 2.
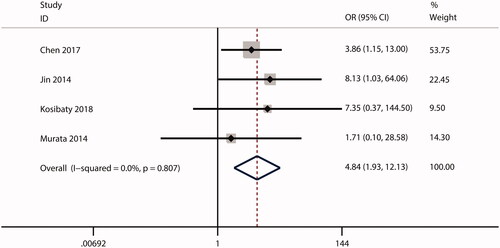
Figure 10. Sensitivity analysis test for the combined HR describing the relationship of ECT2 expression to OS (A) and RFS (B). HR: hazard ratio; OS: overall survival; RFS: recurrence-free survival.
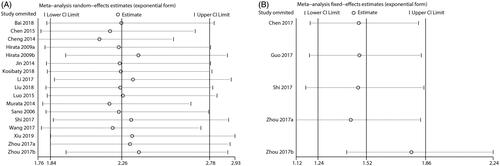
Table 2. Subgroup analysis and meta-regression for HR for the prognostic significance of ETC2 expression.
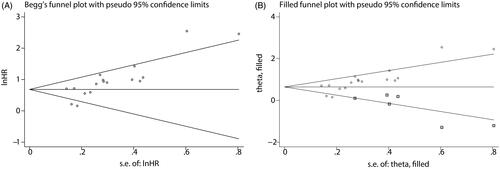
Figure 11. Begg’s funnel plot (A) and the adjusted funnel plot (B) for the combined HR describing the relationship of ECT2 expression to OS. CI: confidence interval; HR: hazard ratio; OS: overall survival; ECT2: epithelial cell transforming sequence 2.