Figures & data
Table 1. Primer sequences of target genes used for qRT-PCR.
Figure 1. Phenformin pre-treatment reduced irradiation-induced mortality and malformation of zebrafish embryos. Treatment groups (control, phenformin alone, irradiation alone, phenformin plus irradiation) were compared for (A) mortality, (B) hatching rate, and (C,D) morphological abnormalities. Panel Da shows a typically developed control embryo for comparison. Common malformations included (Db) spinal column curvature, (Dc) tail curvature, and (Dd) pericardial oedema. **p < .01 vs. control group; #p < .05 vs. irradiation alone group, n = 3 independent replicates (100 embryos per replicate).
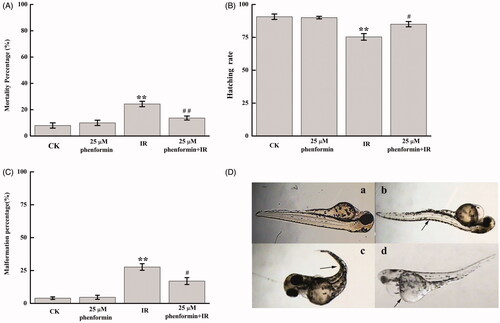
Figure 2. Phenformin reverses spontaneous movement deficits and reduced heart beat rate induced by X-ray irradiation. (A–C) Radiation-induced changes in (A) spontaneous movement at 24 hpf (n = 3 replicates, 14 − 16 embryos per replicate), (B) heart rate at 48 hpf (n = 3 replicates, 8 − 10 larvae per replicate), and (C) swimming behaviour at 144 hpf (n = 3 replicates, 10 − 12 larvae per replicate) and reversal by phenformin pre-treatment. **p < .01 vs. control group; #p< .05 or ##p < .05 vs. irradiation alone group.
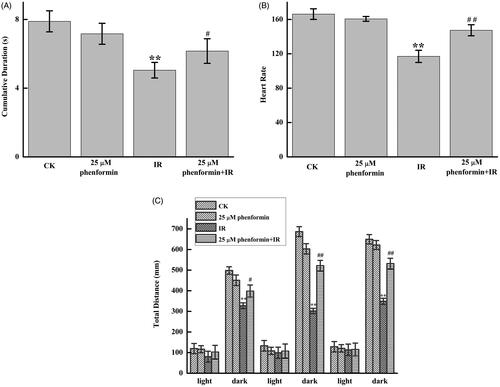
Figure 3. Phenformin sustains antioxidant capacity and AChE activity under irradiation. Effects of X-rays with or with phenformin on SOD activity (A), CAT activity (B), AChE levels (C), and MDA (D). n = 3 replicates, 20 embryos per replicate. **p < .01, vs. control group; #p < .05 or ##p < .05 vs. irradiation group.
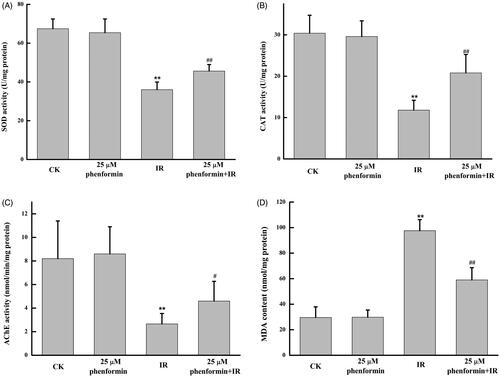
Figure 4. Phenformin shifts apoptosis-related gene expression to the anti-apoptotic state. (A) Expression levels of sod2, bdnf, and ache. (B) Expression levels of p53, bcl-2, and bax. n = 3 replicates, 20 embryos per replicate. **p < .01, vs. control group; #p < .05 or ##p < .05 vs. irradiation group.
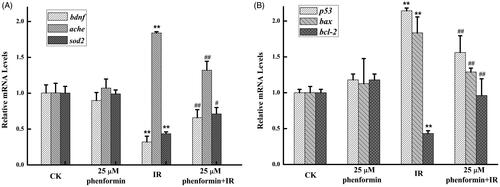
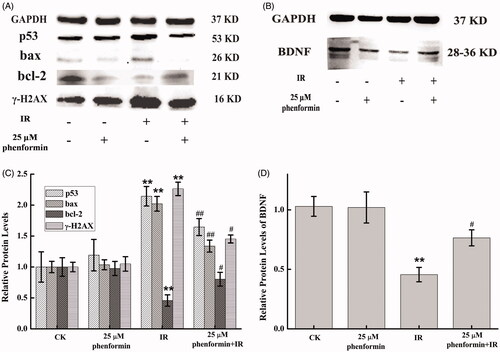
Figure 5. Effects of phenformin on expression of p53, bax, bcl-2 and γ-H2AX (A) and BDNF (B) in zebrafish embryos. (A,B) Assessment of p53, bax, bcl-2, γ-H2AX and BDNF in zebrafish embryos with western blot analysis. (C and D) The ratio of values of p53, bax, bcl-2, γ-H2AX and BDNF/GAPDH. Each value is expressed as the mean ± SEM. **p < .01, vs. control group; #p < .05 or ##p < .05 vs. irradiation group. n = 3 replicates, 20 embryos per replicate.