Figures & data
Figure 1. Overexpression of miR-155 occurred in PCOS tissues. qRT-PCR assay was employed to test expression of miR-155 between PCOS tissues and normal tissues. ***p<.001 in comparison with the normal group. The data were shown as mean ± SD.
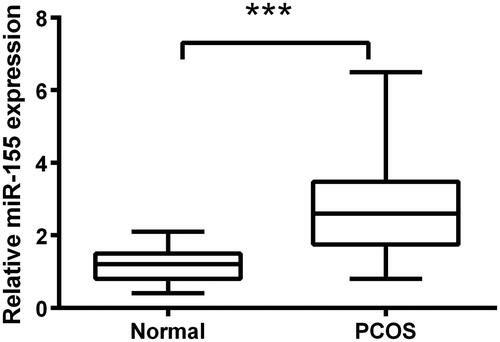
Figure 2. Influence of miR-155 in proliferation and apoptosis was measured in KGN cells, which were transfected with miR-155 mimic, miR-155 inhibitor and relative NC. (A) Level of miR-155 was measured via qRT-PCR. (B) Proliferation was detected via BrdU incorporation assay. (C,D) Cell survival related factors were measured via Western blot analysis. (E) Apoptosis was measured via flow cytometry. (F,G) Levels of apoptosis related factors were tested via Western blot analysis. *p < .05, **p < .01 and ***p < .001 in comparison with related NC. The data were shown as mean + SD.
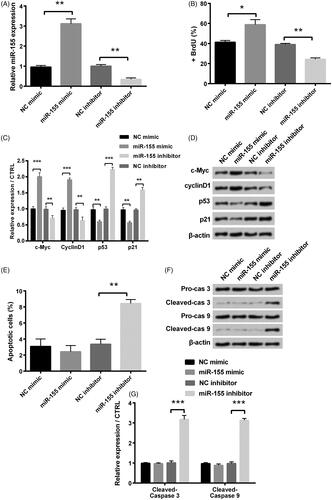
Figure 3. Influence of miR-155 in migration and invasion was measured in KGN cells, which were transfected with miR-155 mimic, miR-155 inhibitor, and relative NC. Cell migration (A) and invasion (B) were tested through a modified two-chamber migration experiment and BioCoatTM Matrigel TM Invasion Chambers, respectively. (C,D) Levels of MMPs and vimentin were examined via Western blot analysis. *p < .05, **p < .01 and ***p < .001 in comparison with related NC. The data were shown as mean + SD.
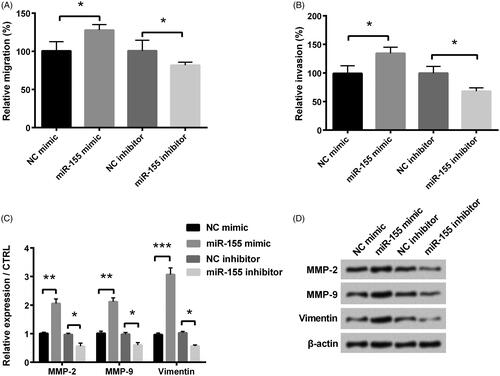
Figure 4. PDCD4 was the target of miR-155 in PCOS. (A) PDCD4’s level was examined via qRT-PCR. (B) Protein level of PDCD4 was tested via Western blot. (C) Luciferase activity experiment determined target relationship between miR-155 and PDCD4. *p < .05 and **p < .01 in comparison with related NC. The data were shown as mean + SD.
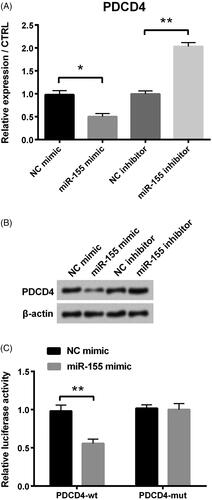
Figure 5. Influence of PDCD4 in proliferation, migration and invasion of KGN cells after co-transfection with miR-155 mimic and pc-PDCD4. (A) Level of PDCD4 was examined via qRT-PCR. (B) Protein level of PDCD4 was examined via Western blot. (C) Proliferation was detected via BrdU. (D-E) Levels of cell survival related factors were measured via Western blot analysis. Effects of PDCD4 on KGN cells’ migration (F) and invasion (G) were examined via a modified two-chamber migration experiment and BioCoatTM Matrigel TM Invasion Chambers, respectively. (H-I) Levels of MMPs and vimentin were examined via Western blot analysis. *p < .05, **p < .01 and ***p < .001 in comparison with related NC. The data were shown as mean + SD.
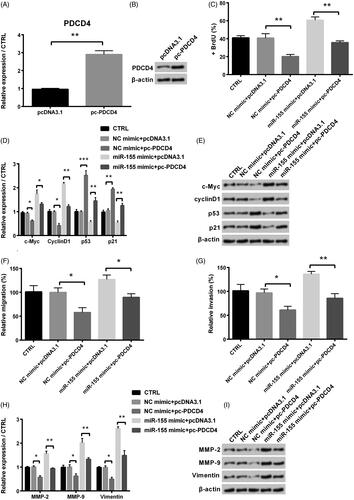
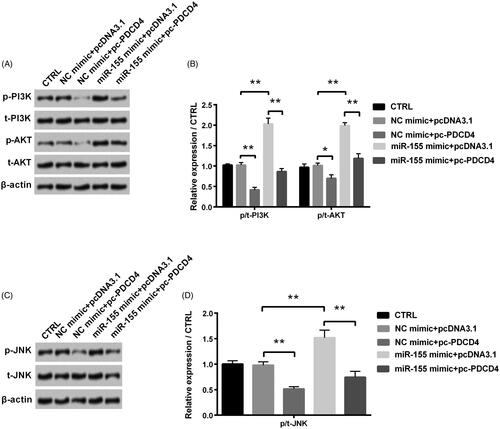
Figure 6. Regulation of PDCD4 and miR-155 in PI3K/AKT and JNK signal pathways was examined after co-transfection with miR-155 mimic and pc-PDCD4. (A,B) Levels of PI3K/AKT signal pathway associated proteins were tested via Western blot analysis. (C,D) Level of JNK signal pathway associated proteins was tested via Western blot analysis. *p < 0.05 and **p < 0.01 in comparison with related NC. The data were shown as mean + SD.