
Figures & data
Figure 1. B. subtilis mitigates biofilm formation by S. mutans in the presence of sorbitol and mannitol.
S. mutans cells were grown with or without B. subtilis (dual- and mono-species suspension, respectively) in TY medium supplemented with different concentrations of either sorbitol or mannitol. TY medium alone and TY with 2% sucrose served as positive and negative controls, respectively. Mono- and multi-species suspensions of the bacterial cells were incubated at 37 °C in 95% air/5% CO2 for 24 h. Biofilm biomass was quantified by the Crystal Violet staining. Data are displayed as relative biofilm biomass compared to the biomass of S. mutans biofilm formed in TY supplemented with 2% sucrose (set to 100%). Data present the means ± SD from at least three independent biological experiments, each performed in triplicate. *p <.01 compared to the S. mutans mono-species biofilm at the same sugar concentration.
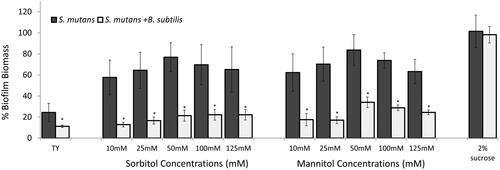
Table 1. Real-time PCR primers used in this study.
Figure 2. B. subtilis and S. mutans growth curves in the presence of sorbitol and mannitol. The bacteria were incubated at 37 °C. O.D (595nnm) measurements were taken every 1 h. A. S. mutans or B. subtilis cells were grown in TY medium supplemented with different concentrations of sorbitol, TY medium alone served as control. B. S. mutans or B. subtilis cells were grown in TY medium supplemented with different concentrations of mannitol, TY medium alone served as control. C. B. subtilis and S. mutans cells were grown in M9 minimal medium or M9 supplemented with 0.2% glucose, 50mM sorbitol or 50 mM mannitol. In both media, B. subtilis cells entered immediately to the log stage in all tested sugar concentrations. However, S. mutans had a long lag phase in M9 in the presence of either sorbitol or mannitol. The data are the mean values of two independent experiments, each formed in duplicate.
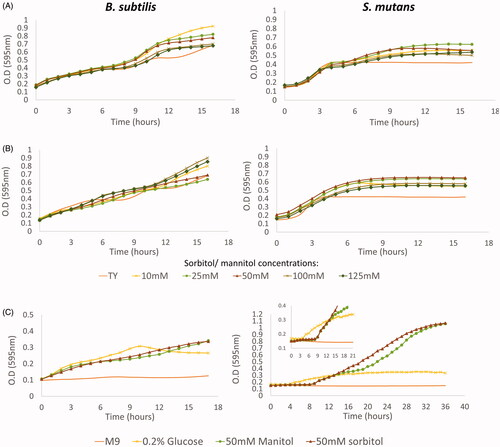
Figure 3. Relative expression of gutB and mtlD genes during bacterial growth in the presence of sugar alcohols. B. subtilis or S. mutans cells were grown in TY medium with or without 50 mM of either sorbitol or mannitol. At each time point, a sample was taken for RNA extraction and relative gene expression was determined by real-time RT-PCR. In both bacteria, the genes were up-regulated in the presence of the sugars; up-regulation was lower in B. subtilis than in S. mutans. Expression results present mean ± SD of two independent experiments each performed in triplicate.
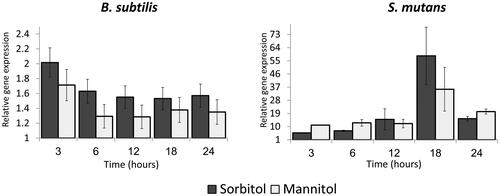
Figure 4. B. subtilis demonstrates extend potential to metabolise sorbitol and mannitol compare to S. mutans in earlier stages of growth. A. B. subtilis or S. mutans cells were grown in TY medium with 50mM sorbitol (A1) or mannitol (A2). At each time point, a sample was taken and the culture metabolic activity was determine using the MTT assay. Although the metabolic activity of B. subtilis was higher than S. mutans in all time points, the difference wad not significant. Results represent mean ± SD of two independent experiments each performed in triplicate. B. B. subtilis or S. mutans cells were grown in M9 medium with 50mM or 100mM sorbitol or mannitol. After 6 h the culture metabolic activity was determine using MTT assay. The metabolic activity of B. subtilis was significantly higher than S. mutans in the presence of sorbitol or mannitol. results represent mean ± SD of two independent experiments each performed in triplicate. C. B. subtilis or S. mutans cells were grown alone or in a co-culture in TY medium with 50mM sorbitol. After 6 h growth, a sample of a media was collected for secondary metabolomics analysis using GCMS. The secondary metabolic profile of B. subtilis is more similar to the profile of the mixed culture than S. mutans secondary metabolic profile. The results represent PCA analysis of three biological experiments each performed in duplicate.
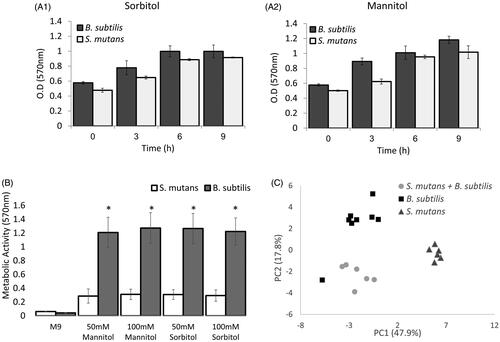
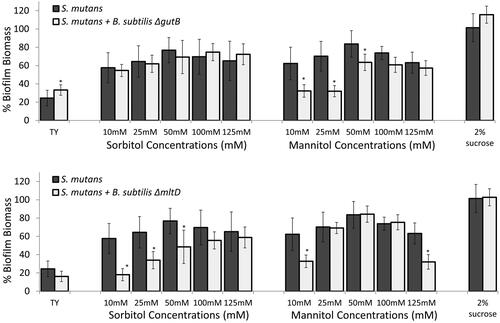
Figure 5. Key enzymes for metabolising either sorbitol or mannitol are required for mitigating S. mutans biofilm. S. mutans cells were grown with or without B. subtilis mutant cells (ΔgutB or ΔmtlD) in TY medium supplemented with different concentrations of sorbitol or mannitol. TY medium alone and TY with 2% sucrose served as controls. Bacteria were incubated at 37 °C in 95% air/5% CO2 for 24 h. Biofilm biomass was quantified by Crystal Violet staining. Data are displayed as relative biofilm biomass compared to S. mutans biofilm formed in TY supplemented with 2% sucrose (set to 100%). B. subtilis mutant strains did not significantly affect biofilm biomass in either case compared to S. mutans biofilm with the related tested sugar. Data are the means ± SD of data from at least three independent biological experiments, each performed in triplicate.*p <.05 compared to S. mutans biofilm alone at the same sugar concentration.
Efficiency_of_Bacillus_subtilis-_supplementary_29.3.2020.docx
Download MS Word (487.9 KB)Data availability statement
The datasets generated and analysed during the current study are available from the corresponding author on reasonable request.