
Figures & data
Figure 1. Experimental set-up. In vitro oxygenation set-up established by Jayaraman et al. [Citation12], used to simulate gas exchange and oxygen delivery from the lungs (fluid reservoir) to hypoxic tissues (gas exchange vessel).
![Figure 1. Experimental set-up. In vitro oxygenation set-up established by Jayaraman et al. [Citation12], used to simulate gas exchange and oxygen delivery from the lungs (fluid reservoir) to hypoxic tissues (gas exchange vessel).](/cms/asset/4465bb24-fab0-4a91-a654-643145762d3f/ianb_a_1879103_f0001_c.jpg)
Table 1. Table of assays.
Figure 2. Net oxygen offloading in mechanism of action comparative study. The net increase in oxygen concentration in the gas exchange vessel for assays 1–4 (). The error bars displayed reflect the SEM. The statistical analysis conducted was a two-tailed, two-sample unequal variance (heteroscedastic) t-test. p-Values are 0.01520, 0.03798, 0.03208 for Saline vs. DDFPe, DDFPe vs TSC, and Saline vs TSC, respectively. For the PTB + Sucrose Control study, p-values are 0.01472 and 0.57763 for DDFPe vs PTB + Sucrose, and Saline vs PTB + Sucrose, respectively.
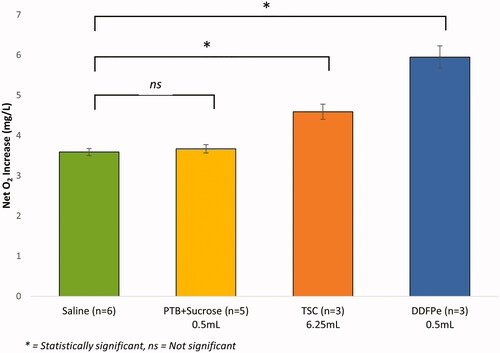
Figure 3. Effect of administered drug product on oxygen transport curve trend. The increase in oxygen concentration in the gas exchange vessel in assays 1–4 (), over the course of 45 min. The Logarithmic trend in oxygenation can be observed from the graph below.
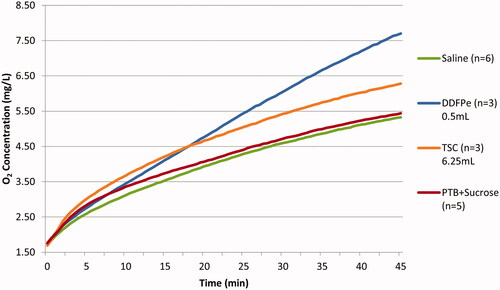
Figure 4. Artificial oxygen carrier vs. kosmotrope mechanism of action. Illustration of theorised oxygen transport mechanism under normal physiological conditions (A), in the presence of PFC based AOCs (B), and in the presence of kosmotropic compounds (C). RBCs flow through the vasculature and release O2 in accordance with local pO2 gradients. The lighter red colour within the vasculature depicts blood plasma, while the red and blue membrane depicts a cell membrane surrounding the cell interior into which O2 must diffuse.
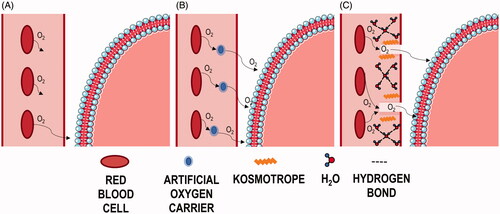
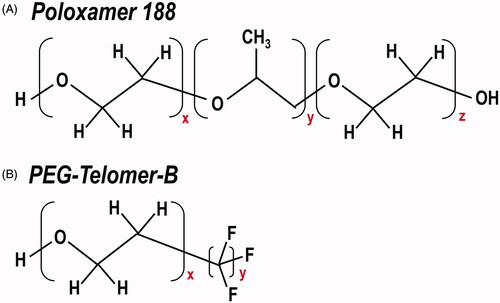
Figure 5. Chemical structure of Poloxamer 188 and PEG-Telomer-B. Comparison of the chemical composition of surfactants (A) Poloxamer 188 and (B) PEG-Telomer-B.
Data availability statement
All data supporting the results or analyses presented in the paper reside at NuvOx Pharma. For further information please contact the corresponding author.