
Figures & data
Figure 1. Schematic illustration of local anticancer drug delivery.
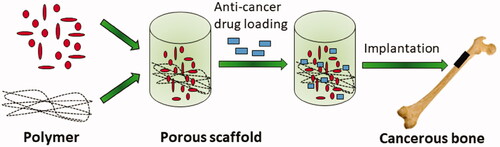
Figure 2. Schematic design of the DOX/HAP-HA nanoparticles. (A) The main components of DOX/HAP-HA nanoparticles: DOX, HAP nanoparticles and HA shell. (B) The antitumor mechanism of DOX/HAP-HA nanoparticles, i.e. drug delivery into the cell nuclei and mitochondria. Tumor target ability of HAP-HA nanoparticles. (C) In vivo fluorescence imaging of the Heps tumor-bearing mice at 1,4,6, 10 and 24 h after intravenous injection of (I) free DiR, (II) DiR/HAP-HA nanoparticles and (III) DiR/HAP-HA nanoparticles with pre-injection of free HA. Arrows indicate the sites of tumors. (D) Ex vivo fluorescence imaging of the tumor and normal tissues harvested from the euthanized Heps tumor-bearing mice at 24 h post injection. The numeric label for each organ is as follows: 1, heart; 2, liver; 3, spleen; 4, lung; 5, kidney; 6, tumor. (E) Region-of-interest analysis of fluorescent signals from the tumors and normal tissues. Error bars indicated s.d. (n = 3). **P < 0.01. Reprinted with permission from Elsevier [Citation33].
![Figure 2. Schematic design of the DOX/HAP-HA nanoparticles. (A) The main components of DOX/HAP-HA nanoparticles: DOX, HAP nanoparticles and HA shell. (B) The antitumor mechanism of DOX/HAP-HA nanoparticles, i.e. drug delivery into the cell nuclei and mitochondria. Tumor target ability of HAP-HA nanoparticles. (C) In vivo fluorescence imaging of the Heps tumor-bearing mice at 1,4,6, 10 and 24 h after intravenous injection of (I) free DiR, (II) DiR/HAP-HA nanoparticles and (III) DiR/HAP-HA nanoparticles with pre-injection of free HA. Arrows indicate the sites of tumors. (D) Ex vivo fluorescence imaging of the tumor and normal tissues harvested from the euthanized Heps tumor-bearing mice at 24 h post injection. The numeric label for each organ is as follows: 1, heart; 2, liver; 3, spleen; 4, lung; 5, kidney; 6, tumor. (E) Region-of-interest analysis of fluorescent signals from the tumors and normal tissues. Error bars indicated s.d. (n = 3). **P < 0.01. Reprinted with permission from Elsevier [Citation33].](/cms/asset/7108fa21-cd3e-4283-931e-58c873ab029e/ianb_a_2016785_f0002_c.jpg)
Figure 3. (A) Sketch of the possible applications of the biomaterials developed. (B) Synthesis of N-thio-substituted β-lactams, reaction yields in parenthesis. Reprinted with permission from Nature [Citation36].
![Figure 3. (A) Sketch of the possible applications of the biomaterials developed. (B) Synthesis of N-thio-substituted β-lactams, reaction yields in parenthesis. Reprinted with permission from Nature [Citation36].](/cms/asset/5f5b5c9c-2219-4fcc-8325-c5d531a07a64/ianb_a_2016785_f0003_c.jpg)
Figure 4. (A) Schematic illustration of the formation of folic acid-polyethylene glycol-pamidronate/calcium phosphate/NLS/pDNA (FA-PEG-Pam/CaP/NDs) nanoparticles and the extracellular and intracellular trafficking for the systemic delivery of plasmid DNA to tumors. Nanoparticles would be internalized into tumor cells via the Folate receptors (FR) mediated endocytosis. After being internalized (i), in the acidic endosomes, FA-PEG-Pam/CaP/NDs nanoparticles would dissolve and the embedded pDNA could escape the endosome by endosome rupture owing to the increase of osmotic pressure (ii). Eventually, pDNA is transported to the nucleus with the aid of NLS due to its nuclear locating ability (iii). (B) In vivo image of RFP gene expression delivered by FA-PEG-Pam/CaP/NDs and its reference formulations injected into bearing 4T1 tumor xenografts BALB/c mice monitored by an NIR fluorescence imaging system. In vivo antitumor activity. The mean (C) tumor volume, (D) body weight, (E) inhibition rate and tumor graph. Scale bar indicates 1 cm. (F) survival rate analysis of BALB/c mice bearing 4T1 tumor xenografts, after intravenous administration of Saline, CaP/NDs, Lipofectamine/NDs and FA-PEG-Pam/CaP/NDs. (G) and (H) Western blotting analysis of p53 protein expression in tumor xenografts transfected with different formulations. (I) H&E staining of tumors of different groups. Blue and pink represent nucleic and cytoplasm, respectively. Red circle indicated apoptosis/necrosis regions and scale bars represent 100 μm. * p < 0.05, ** p < 0.01, and *** p < 0.001. Reprinted with permission from MDPI [Citation69].
![Figure 4. (A) Schematic illustration of the formation of folic acid-polyethylene glycol-pamidronate/calcium phosphate/NLS/pDNA (FA-PEG-Pam/CaP/NDs) nanoparticles and the extracellular and intracellular trafficking for the systemic delivery of plasmid DNA to tumors. Nanoparticles would be internalized into tumor cells via the Folate receptors (FR) mediated endocytosis. After being internalized (i), in the acidic endosomes, FA-PEG-Pam/CaP/NDs nanoparticles would dissolve and the embedded pDNA could escape the endosome by endosome rupture owing to the increase of osmotic pressure (ii). Eventually, pDNA is transported to the nucleus with the aid of NLS due to its nuclear locating ability (iii). (B) In vivo image of RFP gene expression delivered by FA-PEG-Pam/CaP/NDs and its reference formulations injected into bearing 4T1 tumor xenografts BALB/c mice monitored by an NIR fluorescence imaging system. In vivo antitumor activity. The mean (C) tumor volume, (D) body weight, (E) inhibition rate and tumor graph. Scale bar indicates 1 cm. (F) survival rate analysis of BALB/c mice bearing 4T1 tumor xenografts, after intravenous administration of Saline, CaP/NDs, Lipofectamine/NDs and FA-PEG-Pam/CaP/NDs. (G) and (H) Western blotting analysis of p53 protein expression in tumor xenografts transfected with different formulations. (I) H&E staining of tumors of different groups. Blue and pink represent nucleic and cytoplasm, respectively. Red circle indicated apoptosis/necrosis regions and scale bars represent 100 μm. * p < 0.05, ** p < 0.01, and *** p < 0.001. Reprinted with permission from MDPI [Citation69].](/cms/asset/299f03b3-e876-45f7-8a00-91fd62676922/ianb_a_2016785_f0004_c.jpg)
Figure 5. (A) Illustration of the investigation of the fibrinogen (Fgn) interactive states on the HAp NP films of this study. Fng adsorption amount changes on the 15-2-HAp NP film and Au surfaces with the different (B) phosphate ion concentrations and (C) temperatures. Reprinted with permission from Elsevier [Citation74].
![Figure 5. (A) Illustration of the investigation of the fibrinogen (Fgn) interactive states on the HAp NP films of this study. Fng adsorption amount changes on the 15-2-HAp NP film and Au surfaces with the different (B) phosphate ion concentrations and (C) temperatures. Reprinted with permission from Elsevier [Citation74].](/cms/asset/9d3d618c-2157-4ba4-8606-8fd530ac5ffc/ianb_a_2016785_f0005_c.jpg)
Data availability statement
All data are included in the submission/manuscript file.