
Figures & data
Figure 1. Alkaline hydrolysis of poly(styrene-alt-maleic anhydride) to obtain PSMA.
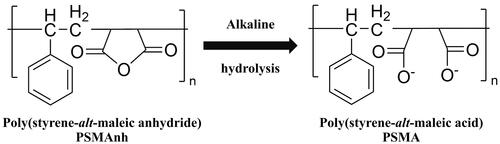
Figure 2. Schematic representation of a mixed PSMA/lipid nanostructure (Paint 3D:6.2003.4017, Microsoft Corporation, 2016).
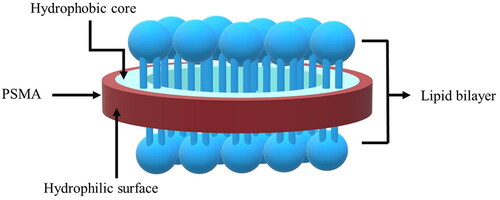
Figure 3. Schematic diagram for the preparation of propolis-loaded PSMA/PC nanoparticles (Paint 3D:6.2003.4017, Microsoft Corporation, 2016).
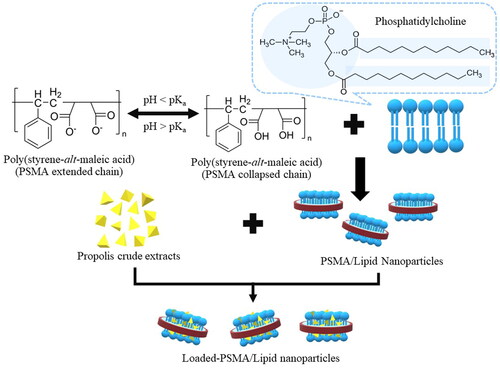
Figure 4. Potentiometric titration curves of PSMA samples; 1000 P (●) and 2000 P (○).
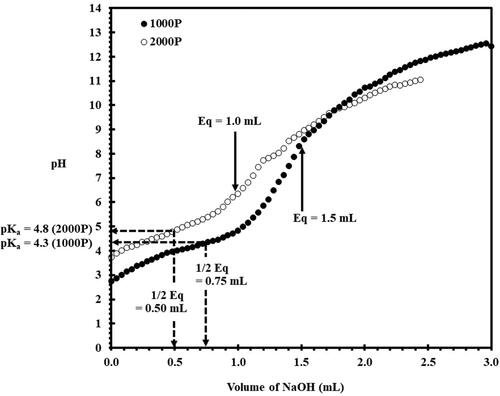
Figure 5. The shelf-life stability for different 1000 P/DLPC formulations.
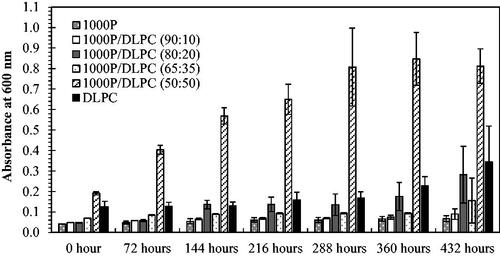
Figure 6. The shelf-life stability for different 1000 P/DMPC formulations.
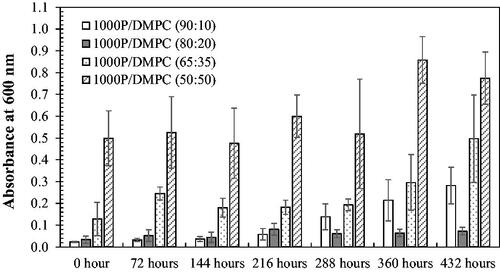
Figure 7. The changes of the averaged UV-absorbance (600 nm) as a function of time for different PSMA/DMPC (90:10) formulations. Results for the aqueous solutions of DMPC and PSMA (1000 P or 2000 P type) are also plotted for comparison.
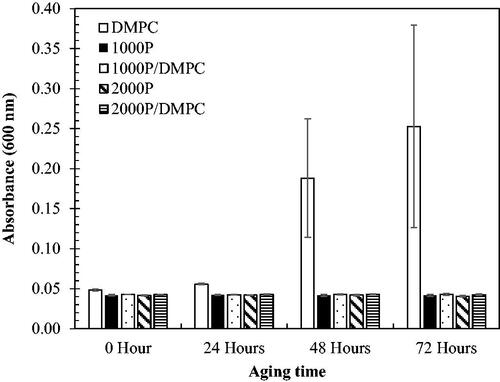
Figure 8. Particle size distribution plots (top) and correlation plots (bottom) of hydrated DMPC (solid blue), 1000 P/DMPC (solid black), and 2000 P/DMPC (solid red) particles. The changes in the DLS profiles after a short-term storage (15 min) were also demonstrated for each sample (dashed lines).
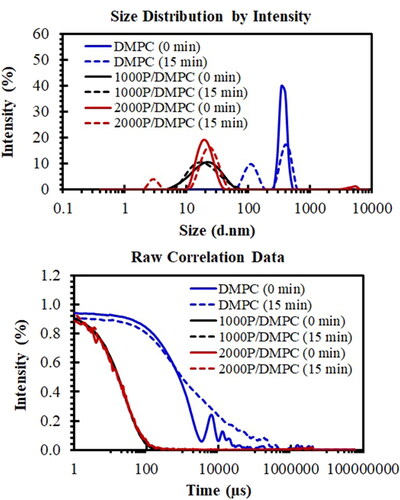
Figure 9. SEM images of DMPC vesicles (a–b) and the PSMA/DMPC particles. Image of (a), (b–d), (e) and (f) were taken at the magnifications of ×500, ×50,000, ×10,000 and ×30,000, respectively.
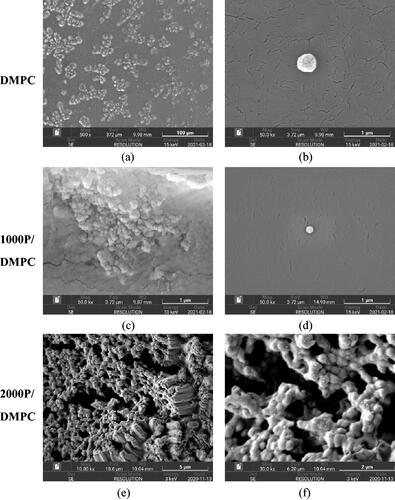
Figure 10. Size distribution plots (top) and correlation plots (bottom) of the loaded-particles of 1000 P/DMPC (solid blue) and 2000 P/DMPC (solid red) in comparison to their corresponding unloaded particles. The changes in the distribution profiles for the loaded-1000P/DMPC (dashed blue) and loaded-2000P/DMPC (dashed red) after a short-term storage (15 min) were also demonstrated (dashed lines).
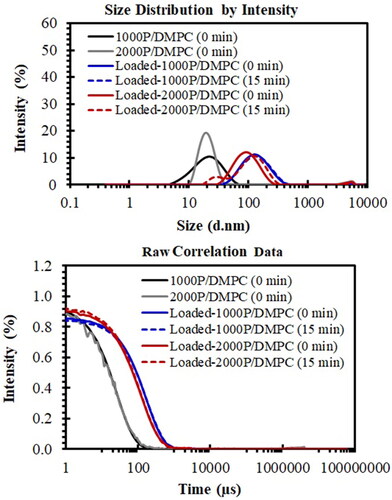
Table 1. Encapsulation efficiency (EE%) of different PSMA/DMPC systems.
Figure 11. Effect of the 1000 P-containing formulations (78–1250 µg/mL) on the Vero cell line viability (%), comparing to those of the control (untreated) and positive (2% Triton-X) groups.
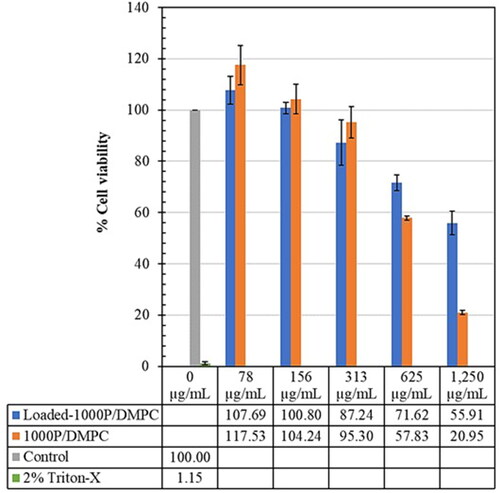
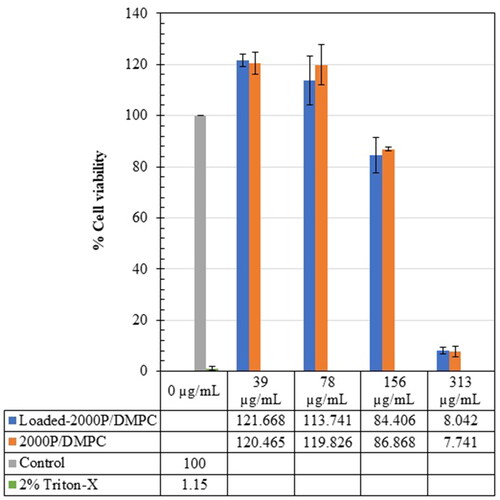
Figure 12. Effect of the 2000 P-containing formulations (39–313 µg/mL) on the Vero cell line viability (%), comparing to those of the control (untreated) and the positive (2% Triton-X) groups.
Data availability statement
The authors confirm that the data supporting the findings of this study are available within the article.